Load Tester 6.7 and earlier does not support Brotli encoding. This is obviously planned for future releases, but for now you may need to use this workaround. If the site just has brotli on static pages there’s no need to do anything special, but if you are testing a site that is using Brotli encoding on security API calls that return session variables you’ll want to read on.
Brotli encoding has been gaining in popularity because it was designed from the group up for streaming. As a result, it reduces latency over gzip, which was originally designed for files … Continue reading »
ASM or Automated State Management is one of Load Tester’s best features, saving loads of time by automatically detecting and configuring dynamic web fields. This makes Load Tester many times faster than trying to configure a test case using a manual tool like JMeter.
The downside is that sometimes the logic picks up fields that don’t really change dynamically, which can have a downside of generating parsing errors when the page layout is different for different users.
Long term you’d probably want to adjust the detection rules to avoid configuring too many fields, but in the short term the Fields … Continue reading »
CRM functionality is so integral to many business workflows that writing a Salesforce app is often cheaper and faster than starting from scratch. Why reinvent the wheel with 50%+ of the functionality you need is already in Salesforce? But just like a 100% custom app, Salesforce apps must be tested for performance, not just functionality, especially when integrating into an existing customer back-office or 3rd party system. And Salesforce is one of the more difficult platforms to test because of the complicated field naming conventions typical of auto-generated front ends.
The first challenge is just the sheer overall complexity of a … Continue reading »
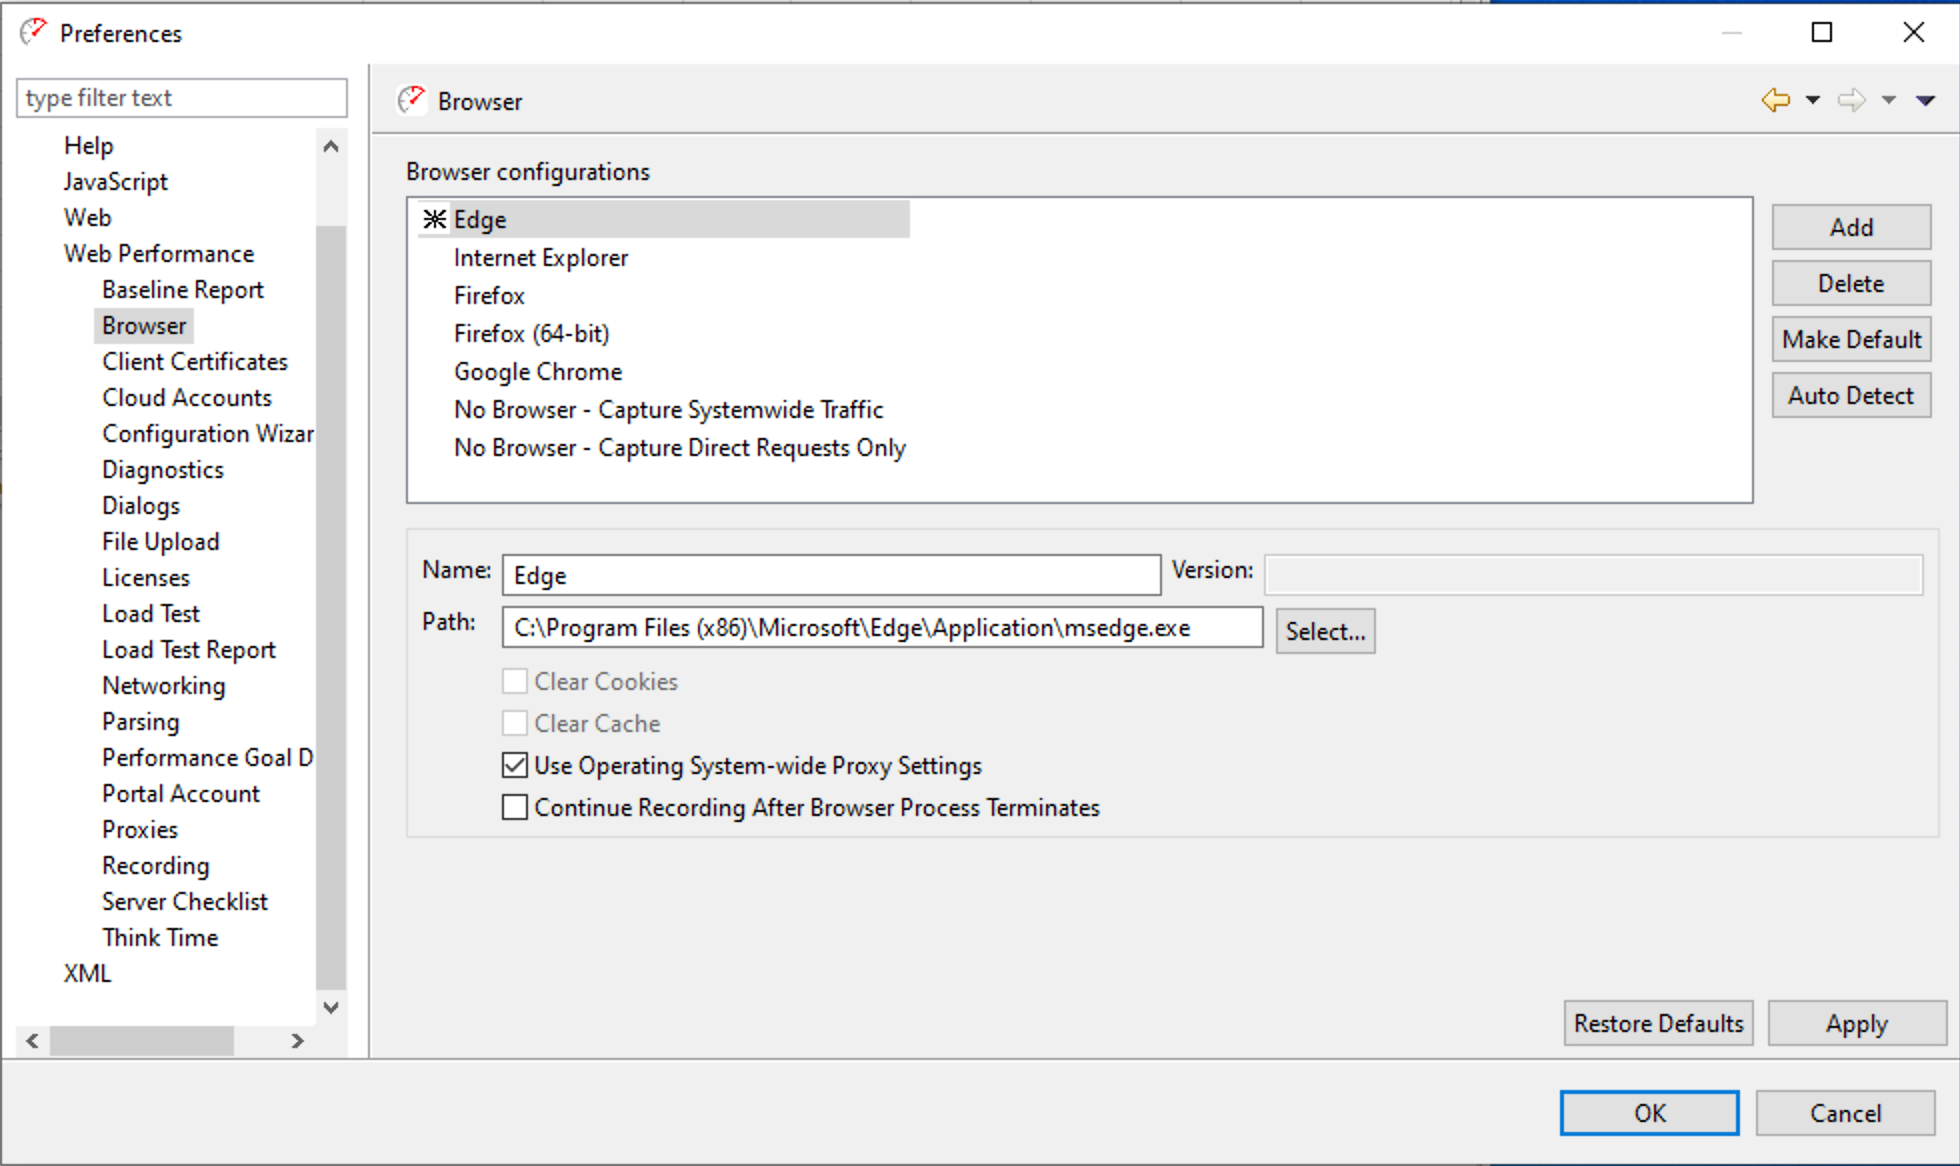
Recently Microsoft has been pushing their new Edge browser release by forcing users to start it upon login. If you want to start recording with Edge then Load Tester has you covered with just a few configuration steps.
First, go to the Browser settings in Load Tester: Window->Preferences->Web Performance->Browser
Click the Add Button on the right and configure a new setting for Edge. The path is as shown above for Windows 10.
Be sure to check “Use Operating System-wide Proxy Settings”!
^^^^^^^^^^^^^^^^^^^^^^^^^^^^^^^^^^^^^^^^^^^^^^^^^^^^^^^^^^^^^^
Click Apply, and then OK.
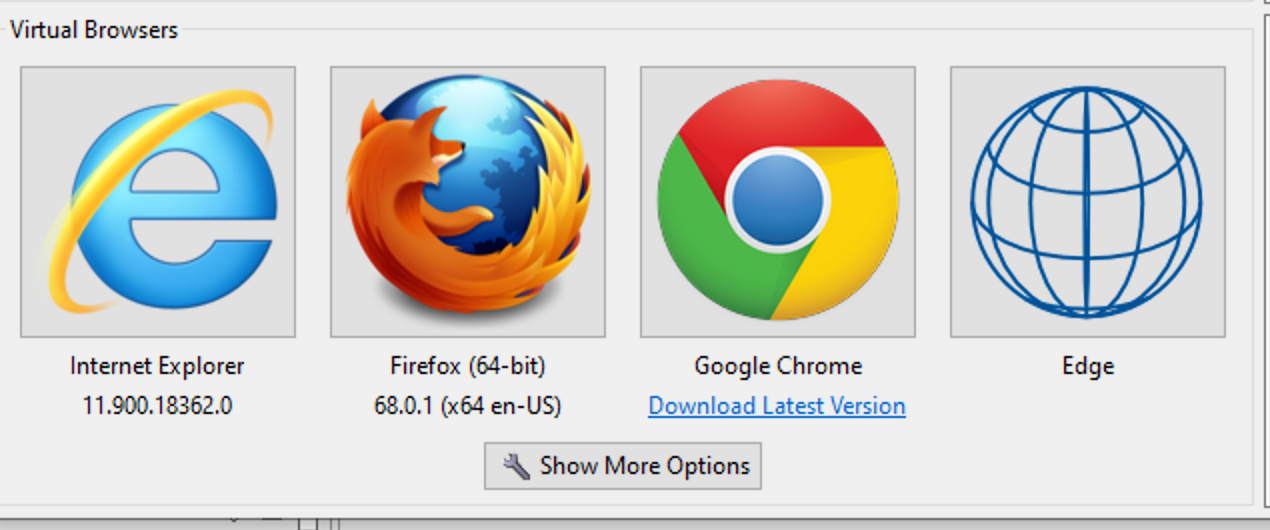
When recording you’ll now see a new option to record with Edge:
You’ll probably … Continue reading »
We recently had a customer question on how to dynamically generate UUIDs during a load test, and the answer illustrates two interesting techniques in Load Tester:
How to use javascript to dynamically generate data during a test.
How to make call outs to the more extensive Java functions within javascript.
In this example let’s assume the UUID is being used as a path element that you want to dynamically replace during a test like this:
http://mysite/path1/123e4567-e89b-12d3-a456-426614174000
Like much of the test case configuration in Load Tester, the process to edit the dynamic behavior starts in the Fields View. Click on the URL to select … Continue reading »
Load Tester 6.7 includes a new option for Virtual User Pacing. When configuring Think Time Generators (Window > Preferences > Web Performance > Think Time), the new checkbox is labeled Distinct – Allow users to have distinct paces. This applies only to the random variation generators. When turned on, it changes how the random variation range is applied to think time.
When turned off, the think time generator will function as it always did – for each think-time encountered, it will vary the think time (as configured in the testcase) by a random value within the configured range. When turned on, … Continue reading »
A method of authentication that has become more popular these days is bearer tokens, which require some additional configuration in Load Tester.
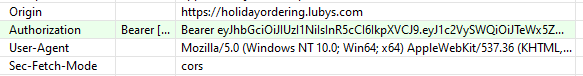
You can first tell if a website uses bearer tokens because the site will throw 404 errors when attempting a playback. Examing the headers will show a header entry called “Authorization” with the format shown below:
The value will appear one or more times. Some sites just set the value once, and others will try and set it on different parts of a website.
The first thing to do is find where the value appears using the Search Tab … Continue reading »
With the advent of AJAX and one-page applications, the concent of a “web page” as a single file with HTML is antiquated. A simple website where the user navigates from page to page has morphed into a web-based application, with complicated user interface elements that aren’t web pages in the traditional sense.
And yet for testing purposes, we need to separate the different stages of a workflow for a web-based application. In Load Tester, then, the concent of a “page” could be anything from a traditional HTML file to a single asynchronous AJAX call. The common denominator is each “page” is … Continue reading »
This Firefox extension is a plugin for SeleniumIDE that makes it easy to collect performance measurements during a test. Installing this extension will add new commands for starting and stopping timers and provides a UI for viewing and downloading the collected measurements.
The problem
Here is the situation: We are running a load test for a customer. The web servers are showing low to moderate CPU utilization and low disk activity. They have plenty of memory available. The middle-tier servers are reporting similar measurements. So is the database. Everything looks good in the load test.
Occasional load-testing tips, performance-engineering notes, and product updates. No spam — unsubscribe anytime.