Site is slow under load, but the servers aren’t busy?!?
The problem
Here is the situation: We are running a load test for a customer. The web servers are showing low to moderate CPU utilization and low disk activity. They have plenty of memory available. The middle-tier servers are reporting similar measurements. So is the database. Everything looks good in the load test.
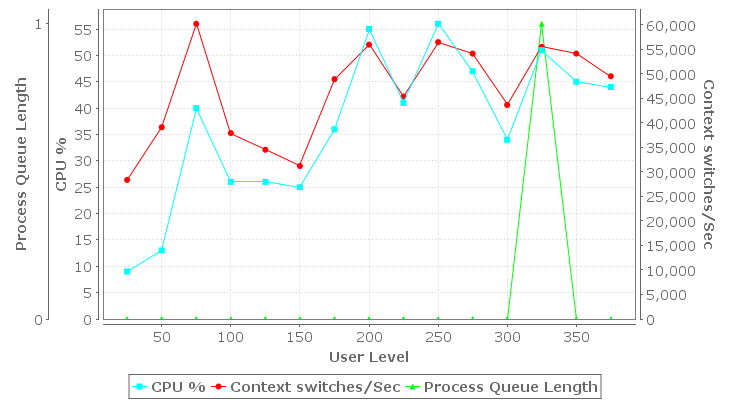
But then, as we apply more load, the user experience begins to suffer – response times degrade a little. Then a lot. Soon they have exceeded the acceptable thresholds and gone far beyond. Eventually, as we continue to increase the load, the virtual users start to detect errors from the severs – such as 500 Internal Server Error. But when we look at the server performance measurements, we find that CPU activity on the web and middle tier servers has actually decreased. The database CPU has leveled off – but is nowhere near fully utilized…and the memory usage and disk activity is still low. Here is an example from a real customer test. Note that as the load increases from 25 to 200 users, the CPU utilization (blue) climbs to ~55%. But as the load continues to increase, CPU utilization does not…in fact, the trend is downwards.
This is a scenario that we encounter frequently in our load testing services. Our customers look to us for guidance on what to do next…and the answer is, almost always, to look at the database. There can be a tendency to dismiss this advice when the metrics “clearly show”, as above, that the database is not busy. Fingers want point at the load-balancer, the firewall, even the load-testing software. Fortunately, those doubts are usually answered pretty quickly, so then we can get back to the database.
Web Performance Consulting
This is one of the reasons we like to have a DBA present for the testing: so that they can inspect the system while it is under load…and capture data needed for later analysis.
Step 1: Long-running queries
I think that finding long-running queries is part of DBA 101 courses (I’m not a DBA, but I sometimes play one on TV). That is the first place to start – are there any queries that are running slowly?
When slow-running queries are found, they need to be addressed in the context of the applied load – are they used frequently in the workflows being tested? If yes, then look for ways to optimize or eliminate those first. For those that are not – they should be prioritized lower.
After optimizing longer-running queries, test again – did it help? Are there more long-running queries to be optimized? Repeat until you are satisfied that no more gains can be made here.
Step 2: Locking and Blocking
Locking is a technique of preventing simultaneous access to a (part of a) database to prevent consistent results.
Blocking is what happens when one user locks some data in the database and then a second user needs to access it. The second user must wait in turn – they are blocked.
If you don’t have simultaneous access, then you won’t have blocking. And even with a handful of users, blocking is highly unlikely to impact performance. This is why blocking frequently does not show up until the system is under load from many simultaneous users. There are a variety of approaches to reduce blocking and there are lots of resources online to help you. The solutions must usually be tailored specifically to the target system.
Again, re-test and iterate as long as opportunities to reduce blocking persist.
Step 3: Parallelism
Sometimes we get to this point: the queries are fast and blocking has been minimized, but the system is still slow under load and the database hardware does not appear stressed – both CPU and disk I/O have capacity to spare. How can that be?
The answer is parallelism. Specifically, this is the number of simultaneous activities that can be performed at the same time. Consider this scenario: A load-test is running and queries are fast – perhaps the average is completed in 20ms. That is pretty fast. But without parallelization, when the incoming rate exceeds 50/sec, then the system will start to slow. This is because at 20ms per operation, 50 operations will take a full second. When the load increases to 100/sec, those 100 operations will take 2 seconds to complete…and some users will be waiting a second longer than they did at 50 ops/sec. What is worse – with each passing second, the system will fall father behind and the response times will continue to degrade. The system is now overloaded…and if it is running on a 16-core server, CPU utilization may be as little as 7% without parallelism in the database.
With 16 cores, allowing 16 operations to run in parallel essentially multiplies the system capacity by a factor of 16 – assuming no other limits are reached (such as Disk I/O, memory, bandwidth or blocking).
The above is a highly simplified description, but the basic concept holds. Parallelism in a modern database is a much more complex topic. For example, many queries could be run in parallel on a single core – for example, work on a second query could start while the first query is waiting for data from disk. As another example: queries may be split into multiple tasks that can be run in parallel.
Modern databases are designed with parallelization in mind and typically turned on with default settings. But the defaults are chosen to be safe, not optimal. Tuning the database, and individual queries, for optimal use of parallel processing is a complex topic. Here is an article that might help you get started in tuning of parallelism in SQL Server:
https://littlekendra.com/2016/07/14/max-degree-of-parallelism-cost-threshold-for-parallelism/
But just changing the amount of parallelism, without understanding the underlying causes, could result in no improvement – or even worse performance. This article helped one of our customers understand why increasing the parallelism in their database didn’t help:
http://www.itprotoday.com/microsoft-sql-server/my-query-not-waiting-because-parallelism
They needed to look deeper into the reasons why changing a global setting made things worse. They were able to tune the parallelism of specific queries to achieve their performance goals.
I hope you can too!
Chris Merrill, Chief Engineer
When his dad brought home a Commodore PET computer, Chris was drawn into computers. 7 years later, after finishing his degree in Computer and Electrical Engineering at Purdue University, he found himself writing software for industrial control systems. His first foray into testing software resulted in an innovative control system for testing lubricants in automotive engines. The Internet grabbed his attention and he became one of the first Sun Certified Java Developers. His focus then locked on performance testing of websites. As Chief Engineer for Web Performance since 2001, Chris now spends his time turning real-world testing challenges into new features for the Load Tester product.
Get web performance news
Occasional load-testing tips, performance-engineering notes, and product updates. No spam — unsubscribe anytime.