Introducing the Influx extension for MuseIDE
InfluxData offers a set of tools that are well-purposed for load testing:
- InfluxDB is a time series database that is very good for storing measurements generated during load testing
- Telegraf is a client that can report performance-related OS measurements to InfluxDB (CPU%, Memory%, bandwidth, network and disk I/O, etc). Useful for monitoring both the load generators and the servers.
- Chronograf is a visualization tool for time-series databases – very handy for visualizing and analyzing load test measurements.
To make use of InfluxDB and Chronograf to store load test measurements from tests built with MuseIDE, we needed to get the measurements into the the database. Preferably live during the test, so that we can monitor and adjust the test as it progresses. Measurements are produced, collected and stored by the plugins included in the Measurements extension. We decided to hook into that mechanism and developed the Influx extension with a plugin that sends measurements to InfluxDB.
After adding the plugin to the project, it just needs a few configuration details, such as the hostname and port where InfluxDB is listening for incoming measurements. Also the database where it should be stored, and any metadata that should be used to filter out measurements that don’t need to go to InfluxDB.
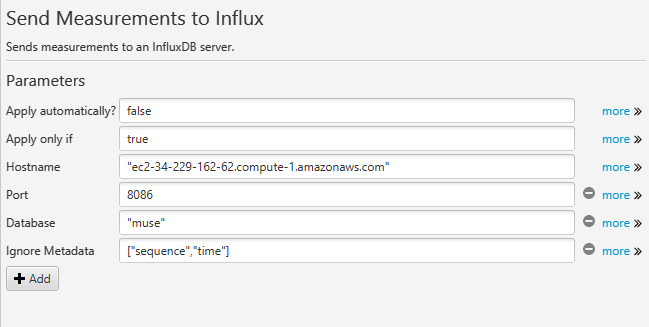
In the above example, we are ignoring some metadata that is useful when writing measurements to CSV files, but not needed for InfluxDB. It doesn’t hurt, but is extraneous and thus filtered out here. Also note that you need to create the database before sending measurements to it. That is done easily on the InfluxDB Adminstration tab in Chronograf.
You also need some of the plugins in the Measurements extension configured. As an example, the Step Duration Producer plugin, which produces measurements related to step duration and status. Along with that, you need the Periodic Measurement Collector plugin which will, unsurprisingly, periodically collect those measurements and distribute them to measurement consumers. The Send Measurement to Influx plugin is one of those consumers.
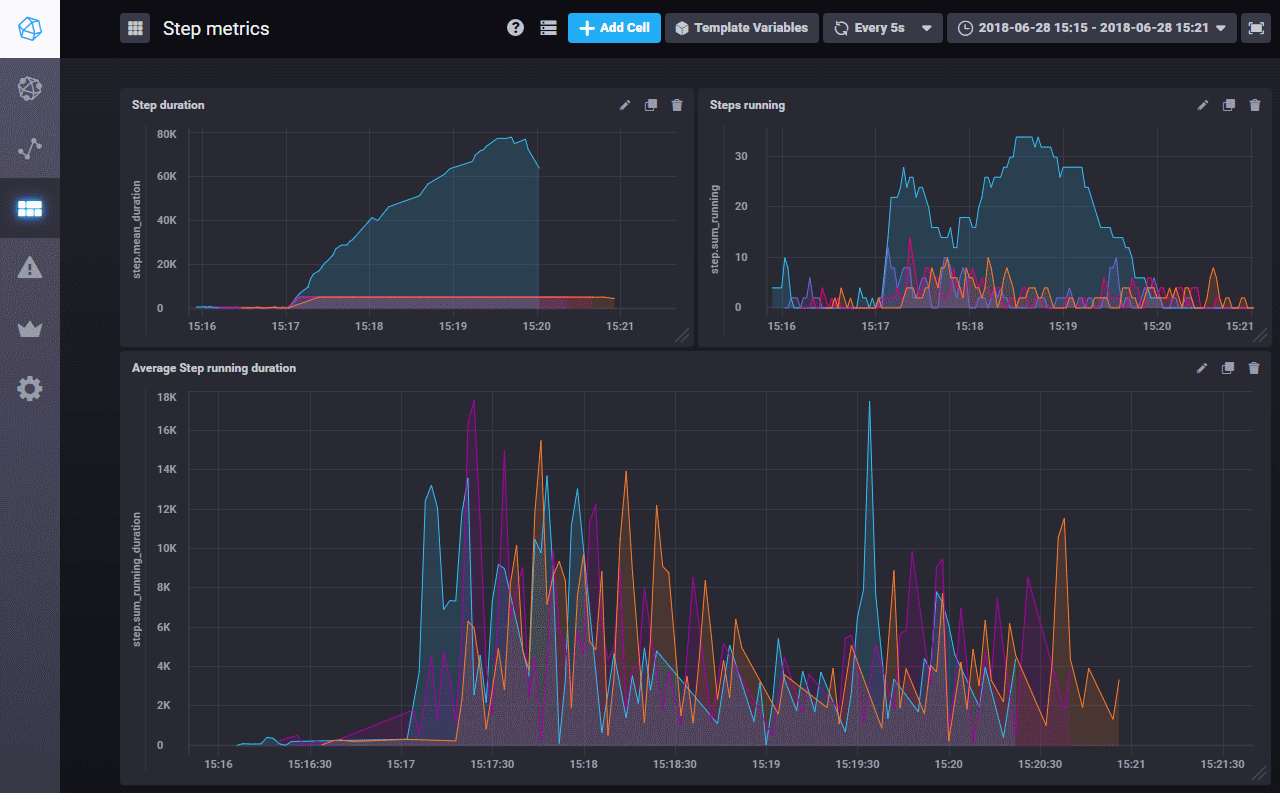
When that is all in place and a test is running, the measurements are sent to Influx and can be viewed live (or after the fact) in Chronograf, such in the dashboard shown below. Filters can be applied to the measurements – in the example below only 4 specific steps (page loads) are being charted and they are shown in different colors. The first chart (completed step duration) clearly shows that the performance of one page is degrading drastically during the test. The other charts show how many of each step are running and for how long they have been running.
All of this can be done with the open-source versions of Influx, Telegraf and Chronograf. Let us know how it works out for you!
The Send Measurements To Influx plugin is part of the Influx 0.1 extension and can be installed directly into a MuseIDE project from the Extensions manager. For open-source tinkerers, the Influx extension source is on GitHub.
When his dad brought home a Commodore PET computer, Chris was drawn into computers. 7 years later, after finishing his degree in Computer and Electrical Engineering at Purdue University, he found himself writing software for industrial control systems. His first foray into testing software resulted in an innovative control system for testing lubricants in automotive engines. The Internet grabbed his attention and he became one of the first Sun Certified Java Developers. His focus then locked on performance testing of websites. As Chief Engineer for Web Performance since 2001, Chris now spends his time turning real-world testing challenges into new features for the Load Tester product.
Get web performance news
Occasional load-testing tips, performance-engineering notes, and product updates. No spam — unsubscribe anytime.