Load Testing Blog
Distinct Think Time setting for Virtual User Pacing
Load Tester 6.7 includes a new option for Virtual User Pacing. When configuring Think Time Generators (Window > Preferences > Web Performance > Think Time), the new checkbox is labeled Distinct – Allow users to have distinct paces. This applies only to the random variation generators. When turned on, it changes how the random variation range is applied to think time.
When turned off, the think time generator will function as it always did – for each think-time encountered, it will vary the think time (as configured in the testcase) by a random value within the configured range. When turned on, … Continue reading »
Configuring Bearer Tokens for Load Testing
A method of authentication that has become more popular these days is bearer tokens, which require some additional configuration in Load Tester.
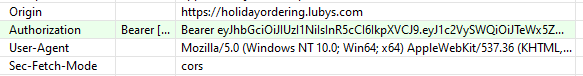
You can first tell if a website uses bearer tokens because the site will throw 404 errors when attempting a playback. Examing the headers will show a header entry called “Authorization” with the format shown below:
The value will appear one or more times. Some sites just set the value once, and others will try and set it on different parts of a website.
The first thing to do is find where the value appears using the Search Tab … Continue reading »
Understanding Web Pages in Modern Web Apps
With the advent of AJAX and one-page applications, the concent of a “web page” as a single file with HTML is antiquated. A simple website where the user navigates from page to page has morphed into a web-based application, with complicated user interface elements that aren’t web pages in the traditional sense.
And yet for testing purposes, we need to separate the different stages of a workflow for a web-based application. In Load Tester, then, the concent of a “page” could be anything from a traditional HTML file to a single asynchronous AJAX call. The common denominator is each “page” is … Continue reading »
Measurements plugin for SeleniumIDE is now available in the Firefox add-ons store
This Firefox extension is a plugin for SeleniumIDE that makes it easy to collect performance measurements during a test. Installing this extension will add new commands for starting and stopping timers and provides a UI for viewing and downloading the collected measurements.
Site is slow under load, but the servers aren’t busy?!?
The problem
Here is the situation: We are running a load test for a customer. The web servers are showing low to moderate CPU utilization and low disk activity. They have plenty of memory available. The middle-tier servers are reporting similar measurements. So is the database. Everything looks good in the load test.
Checking HTTP status codes from your Selenium/Java tests with the Meddler extension
Over the years, I’ve see a couple of questions repeatedly on the Selenium boards related to HTTP status codes: How do I check for broken links (404s)? How can I check the status code of a web-service request made from my web-app? The answer is usually “Selenium can not do that” because, of course, Selenium is a browser automation tool – not a full-featured testing solution. Other answers suggest various solutions…none that I’ve seen are elegant.
How to Handle a Website where Cookies are set via Javascript
The process instead is to locate where the cookie value is set in javascript, parse the value, and set the cookie value inside the cookie store. The new cookie value is then updated in every subsequent transaction automatically.
Backup and Restore Chronograf Dashboards
Chronograf is a web-based GUI for visualizing time-series data, typically from a time-series database such as InfluxDB. I have been using it recently to store load-test measurements created by the MuseIDE Measurements extension.
I have been running it in the cloud, starting up a fresh instance whenever I have the need for storing load test results. This is handy and very cost-effective, but starting from scratch means that I need to set up dashboards of the metrics I want to see every time.
Introducing the Influx extension for MuseIDE
InfluxData offers a set of tools that are well-purposed for load testing:
InfluxDB is a time series database that is very good for storing measurements generated during load testing
Telegraf is a client that can report performance-related OS measurements to InfluxDB (CPU%, Memory%, bandwidth, network and disk I/O, etc). Useful for monitoring both the load generators and the servers.
Chronograf is a visualization tool for time-series databases – very handy for visualizing and analyzing load test measurements.
Measurements extension 0.3 now available
The 0.3 release adds some new plugins and enhancements applicable to performance and load testing:
New Test Plugins
The new Test Duration Plugin creates measurements of individual tests (# running, duration, etc.).
The new Step Summary Measurements plugin creates sampled measurements on steps such as success, failure and error counts, running count, running duration.
Enhancements to existing plugins
The Periodic Measurement Collector plugin can now tag measurements with the source hostname
The Step Duration Producer plugin has 3 new features for improving test analysis
The Save Measurements to CSV plugin now writes a footer line at the end of the file. The footer line … Continue reading »