Test Duration Producer plugin
This plugin is part of the Measurements extension for MuseIDE version 0.3. It is a test-suite plugin that provides measurements to illustrate how many of each test are running, how long have they been running and how long did they take to complete. It is intended to be helpful for load testing.
Each time a test within a suite completes, a measurement is produced containing the duration of the test. If the running tests parameter is true, then each time measurements are collected by the Periodic Measurement Collector, two additional measurements are produced for each test. The first, running, is a count of how many tests are running at that moment. The second, running_duration, is the total duration that those tests have been running.
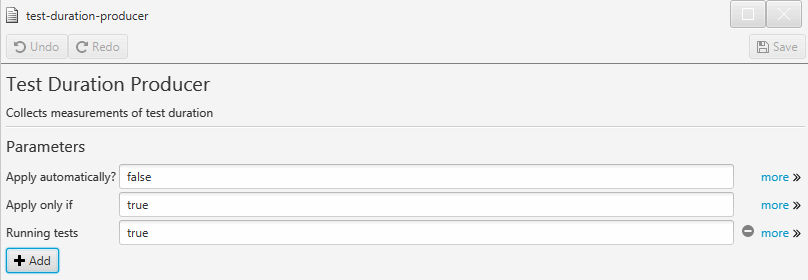
Configuration
Add the plugin to your project and configure it to run when needed. Use the Running tests parameter to turn on/off the running and running_duration measurements.
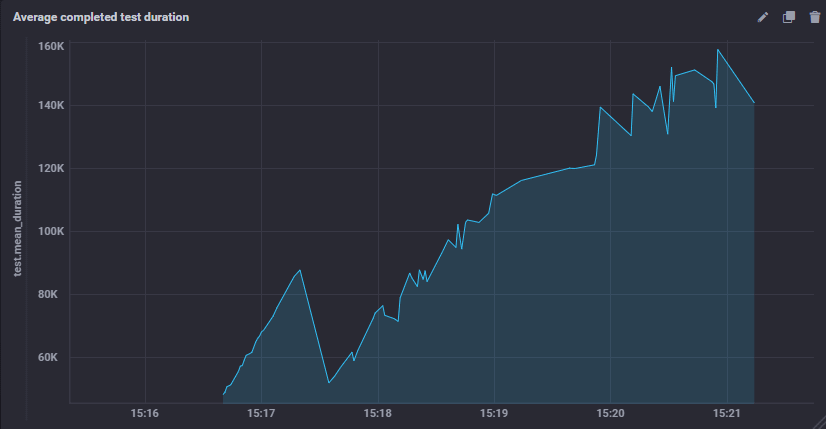
Plotting in Chronograf
Chronograf and InfluxDB provide a powerful toolset for collecting, analyzing and charting time-series data.
When combined with the Periodic Measurement Collector plugin and the Send Measurements to Influx plugin, you can easily see the average duration of each completed test in Chronograf. This chart shows the test duration increasing significantly over time.
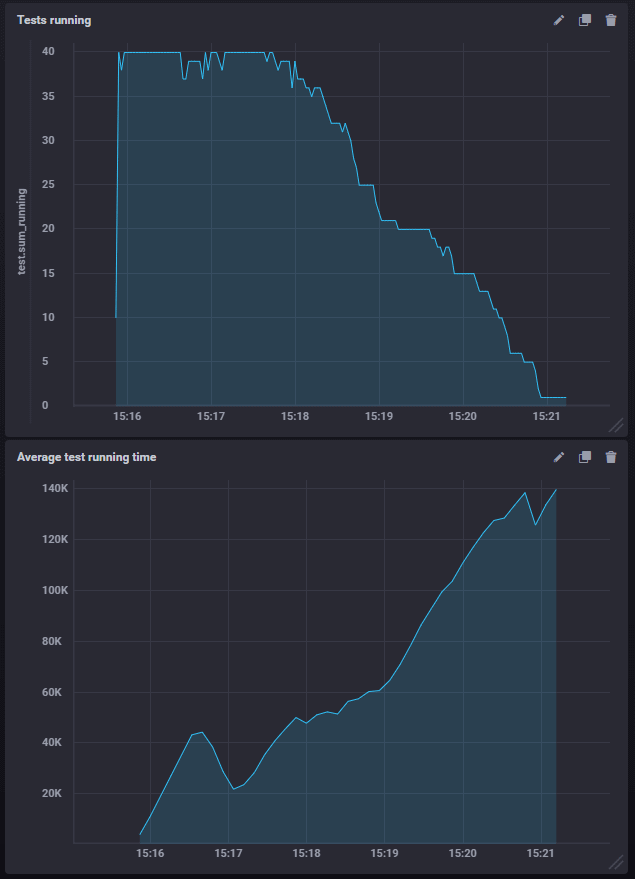
You can also see the running duration and the total number of tests running. These charts show that even as the number of concurrently running tests is decreasing, the average running duration of the tests is increasing.
Output for a spreadsheet
You can also perform your own analysis in a spreadsheet when combining this plugin with the Periodic Measurement Collector plugin and the Store Measurements to CSV files plugin. Together they produce a CSV file for each test. You might then use the charting features of the spreadsheet to plot the average running duration and completed durations like this:
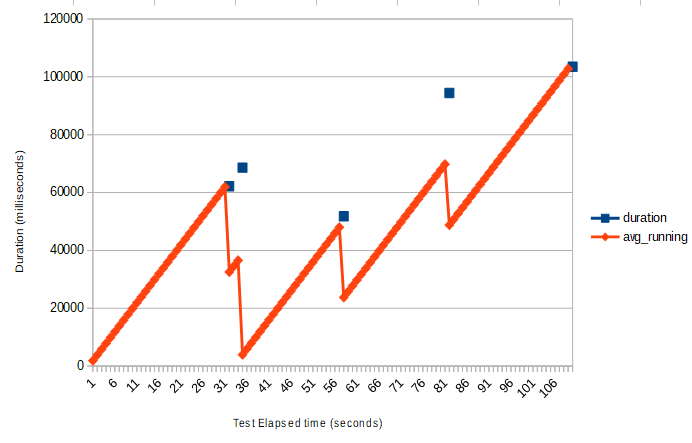
Note that if you are running Muse tests in parallel on many machines, the CSV files would need to be merged to provide higher-level insight into the system performance.
Are you using InfluxDB orChronograf for analyzing load test measurements? We’d love to hear about it! If you have written about it, send us a link and we’ll post it here.
When his dad brought home a Commodore PET computer, Chris was drawn into computers. 7 years later, after finishing his degree in Computer and Electrical Engineering at Purdue University, he found himself writing software for industrial control systems. His first foray into testing software resulted in an innovative control system for testing lubricants in automotive engines. The Internet grabbed his attention and he became one of the first Sun Certified Java Developers. His focus then locked on performance testing of websites. As Chief Engineer for Web Performance since 2001, Chris now spends his time turning real-world testing challenges into new features for the Load Tester product.