Load Tester 6.9 is Here!
Introducing Interactive Analytics Dashboard
|
|
|
We’re excited to announce Web Performance Load Tester 6.9, featuring our most significant enhancement yet: the all-new Interactive Analytics Dashboard.
Say goodbye to static PNG reports and hello to real-time, interactive insights that transform how you analyze load test results.
|
|
|
🎯 Interactive Analytics Dashboard
|
|
|
The future of load test analysis is here:
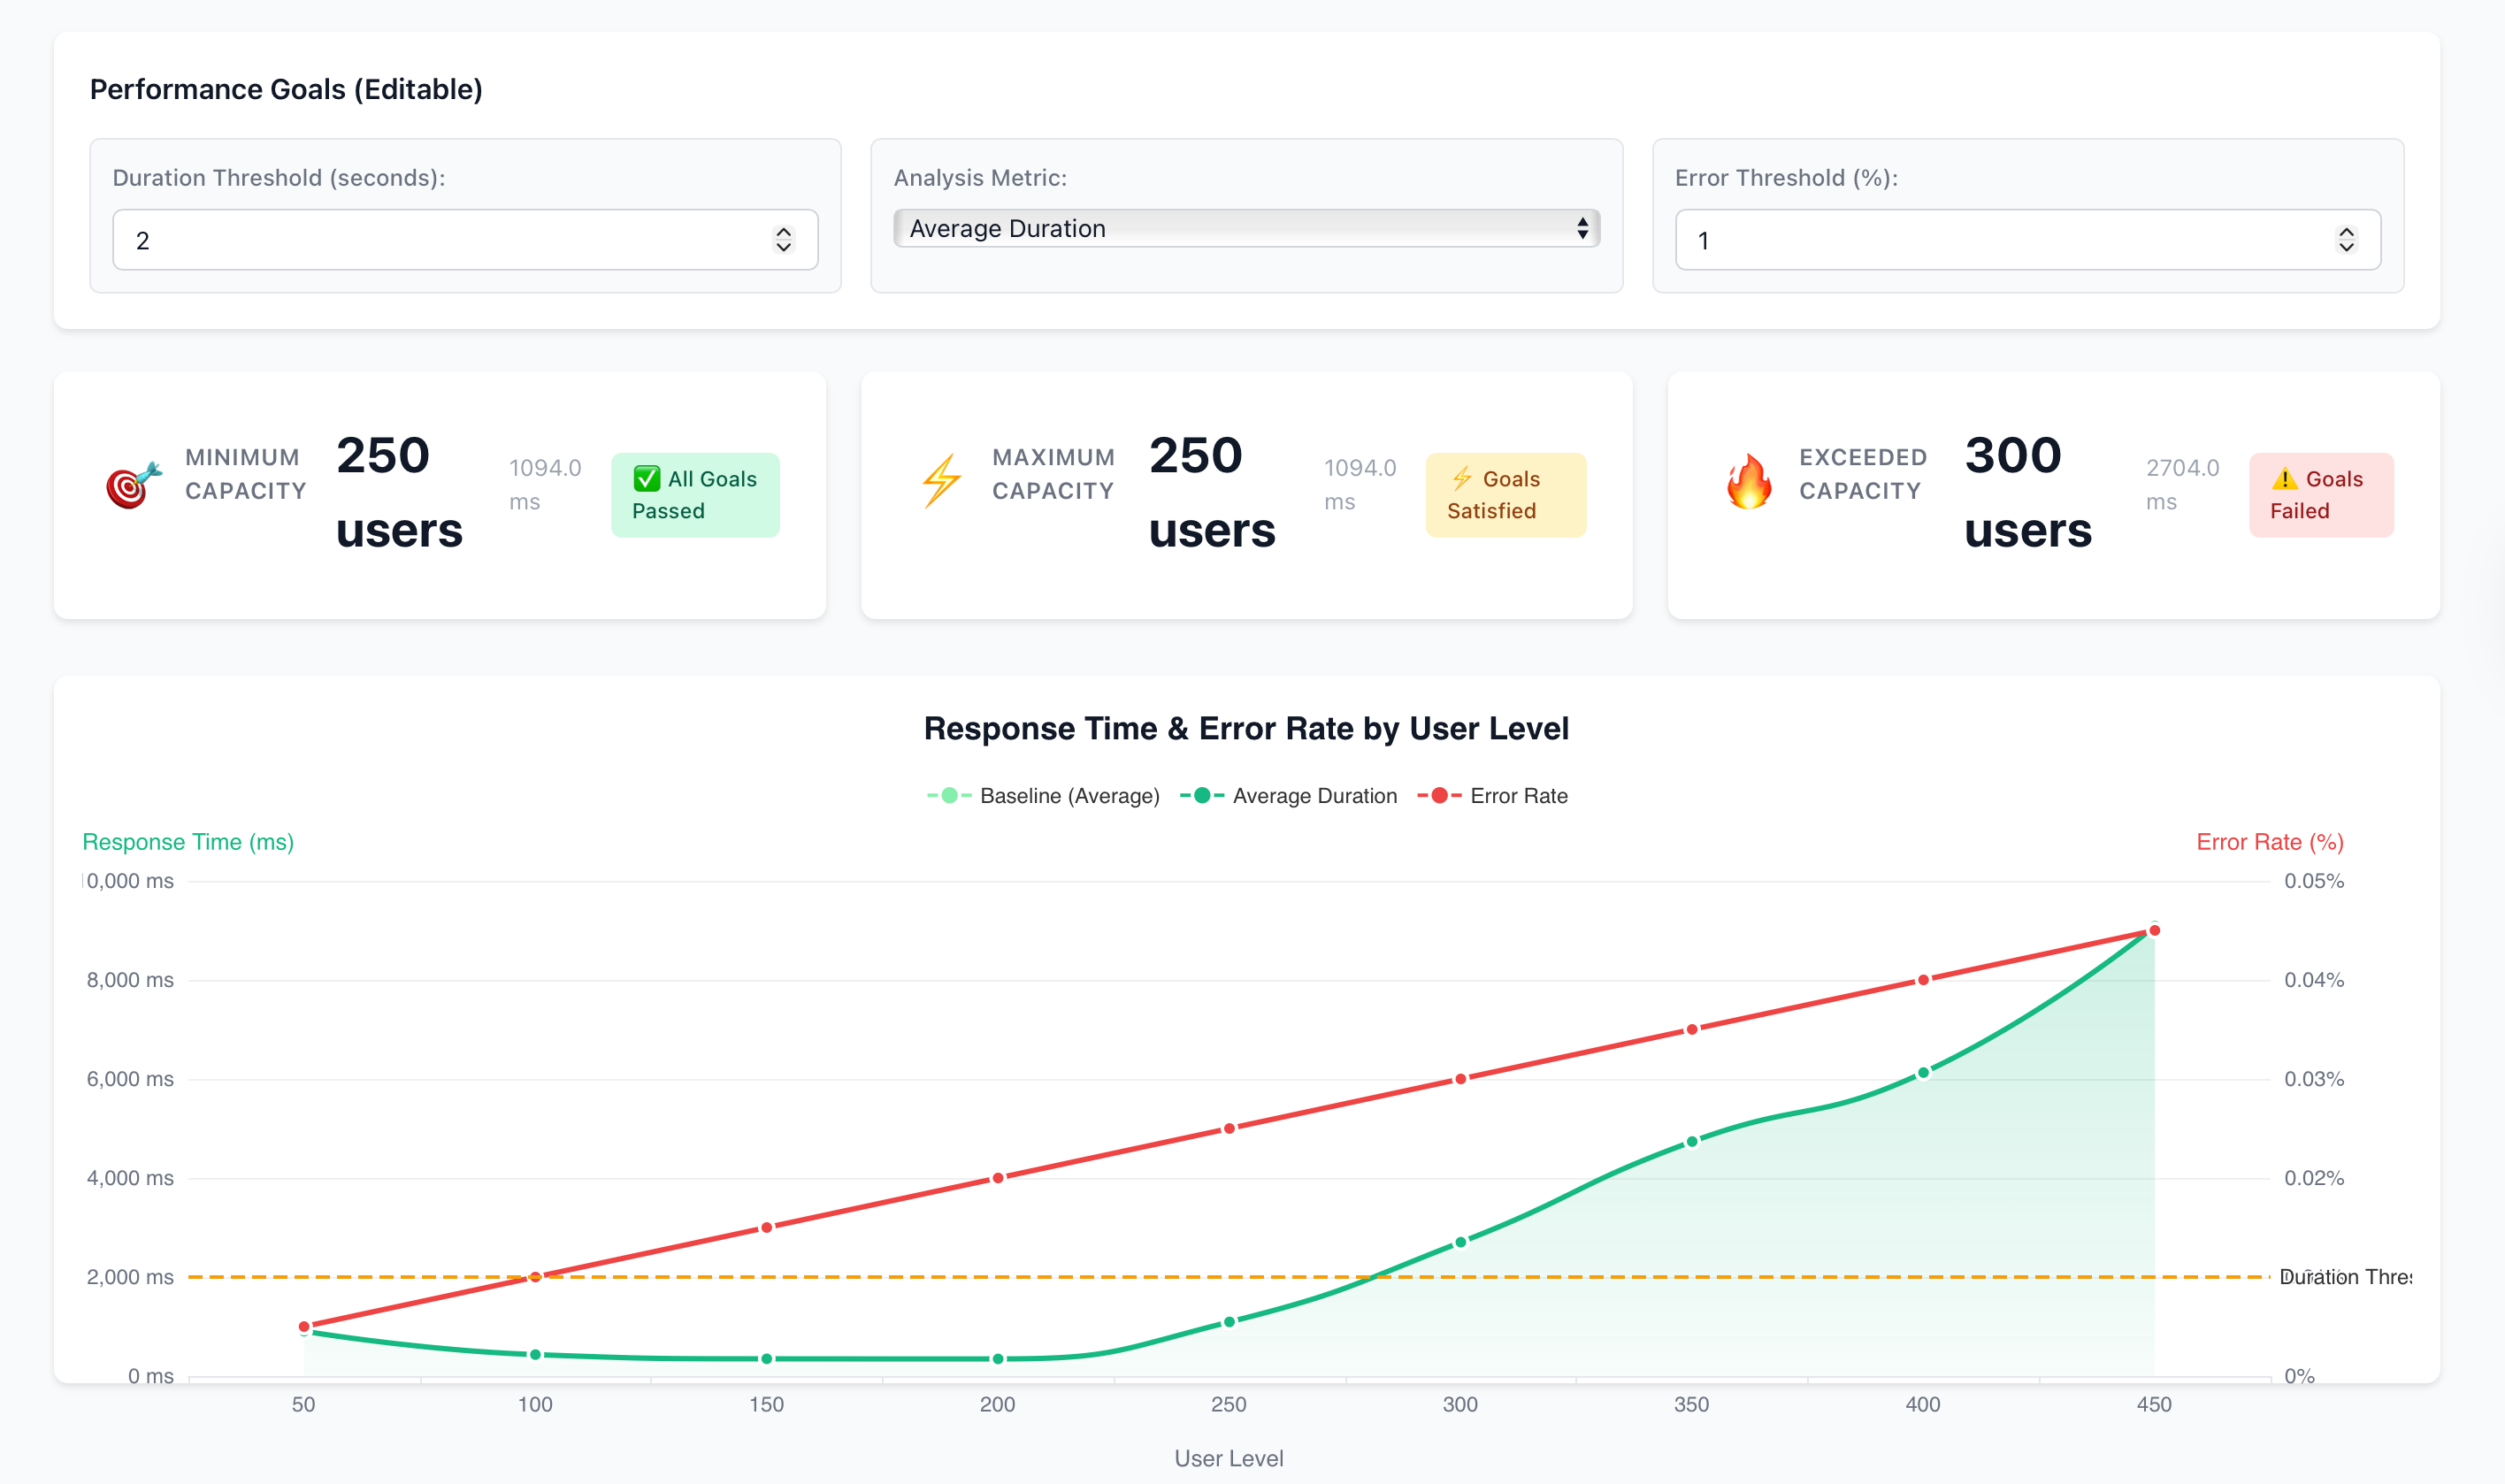
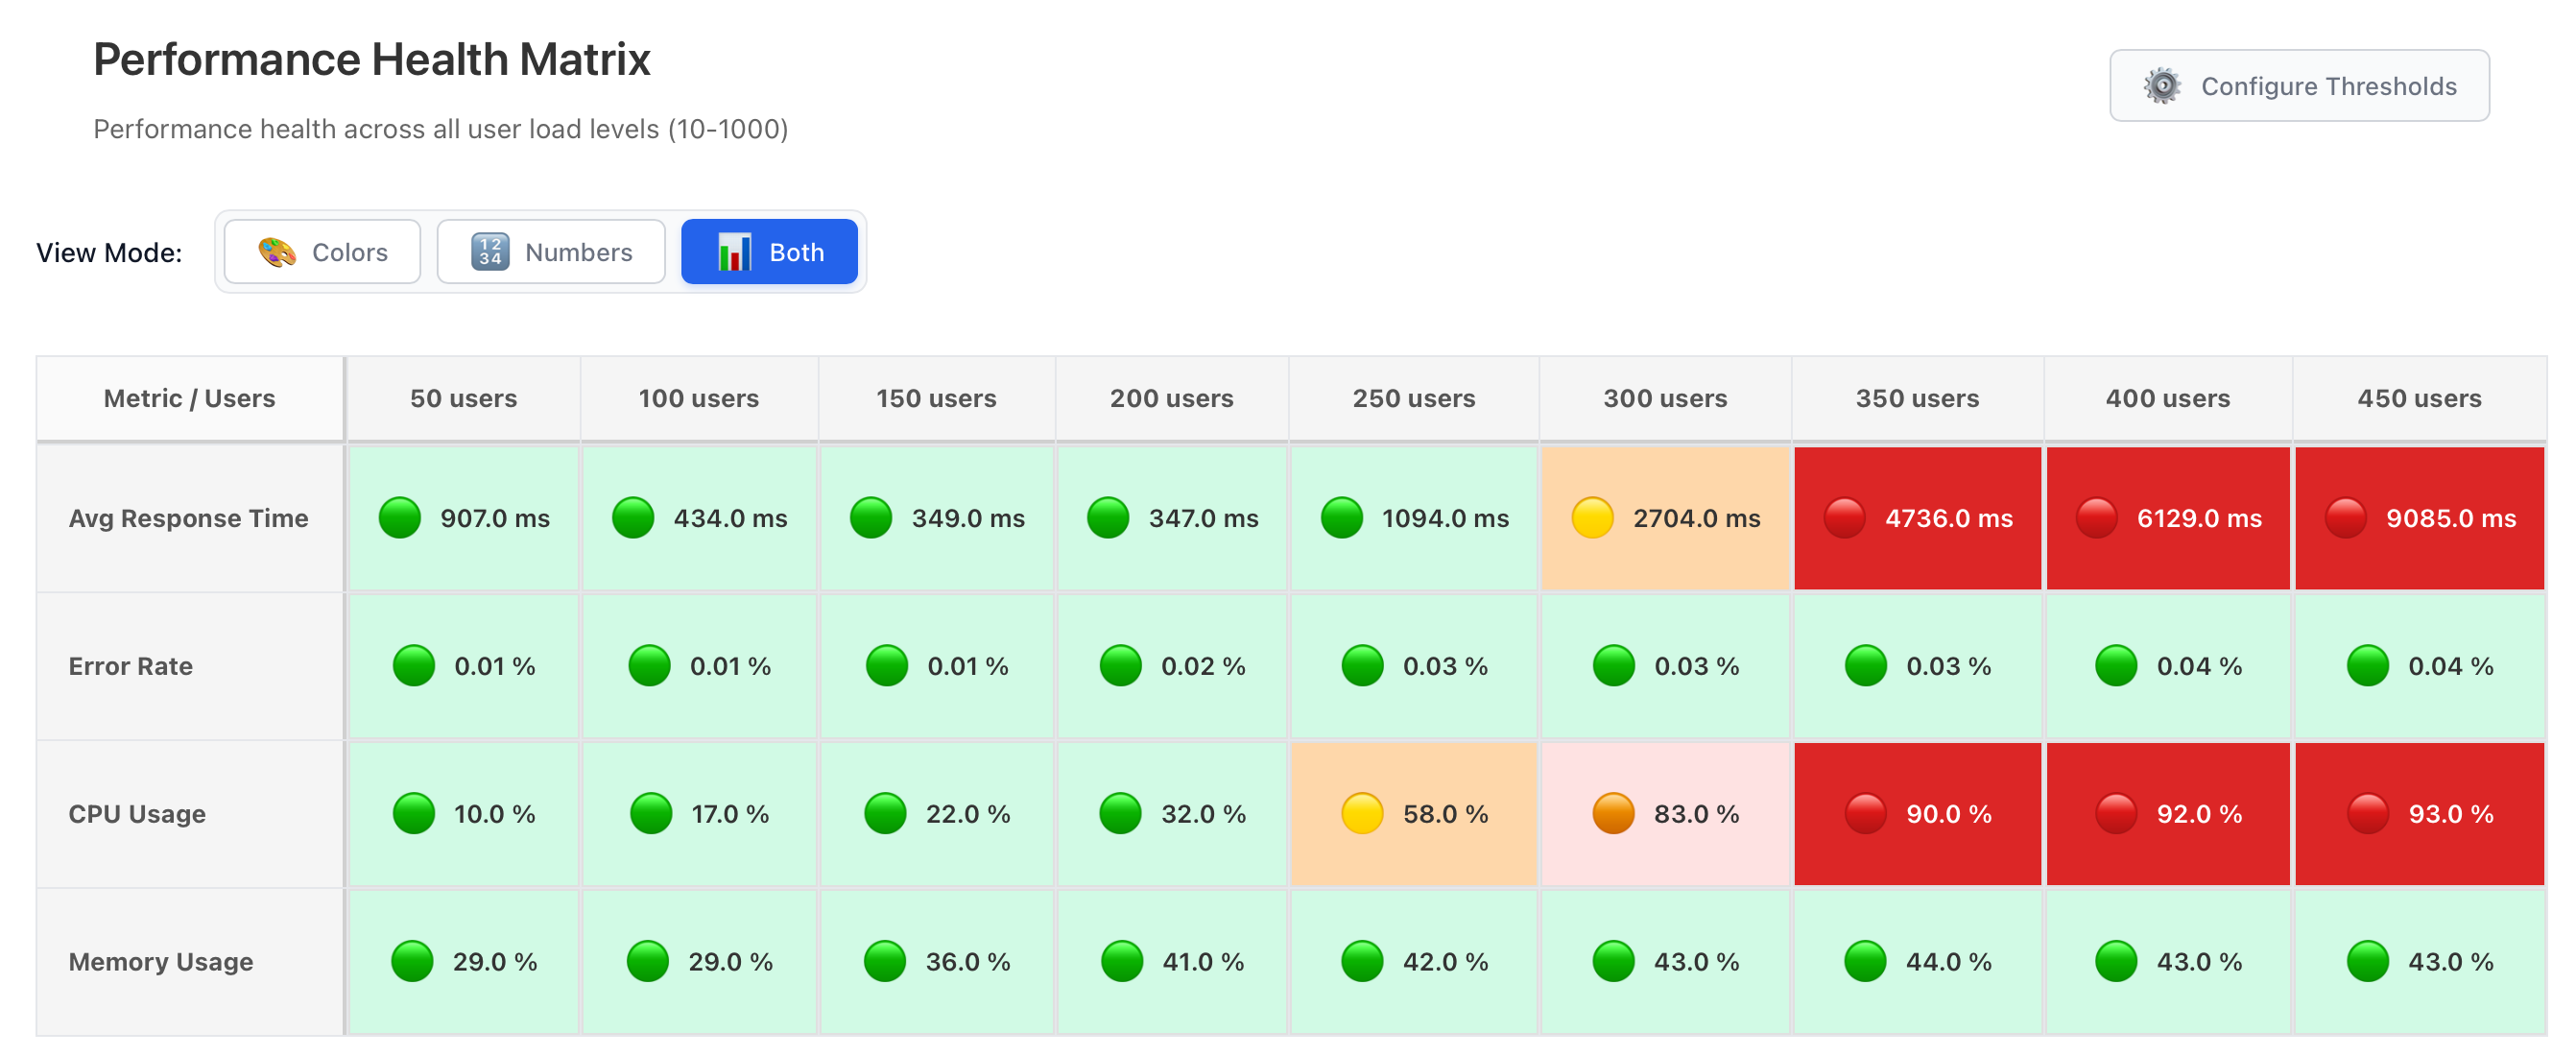
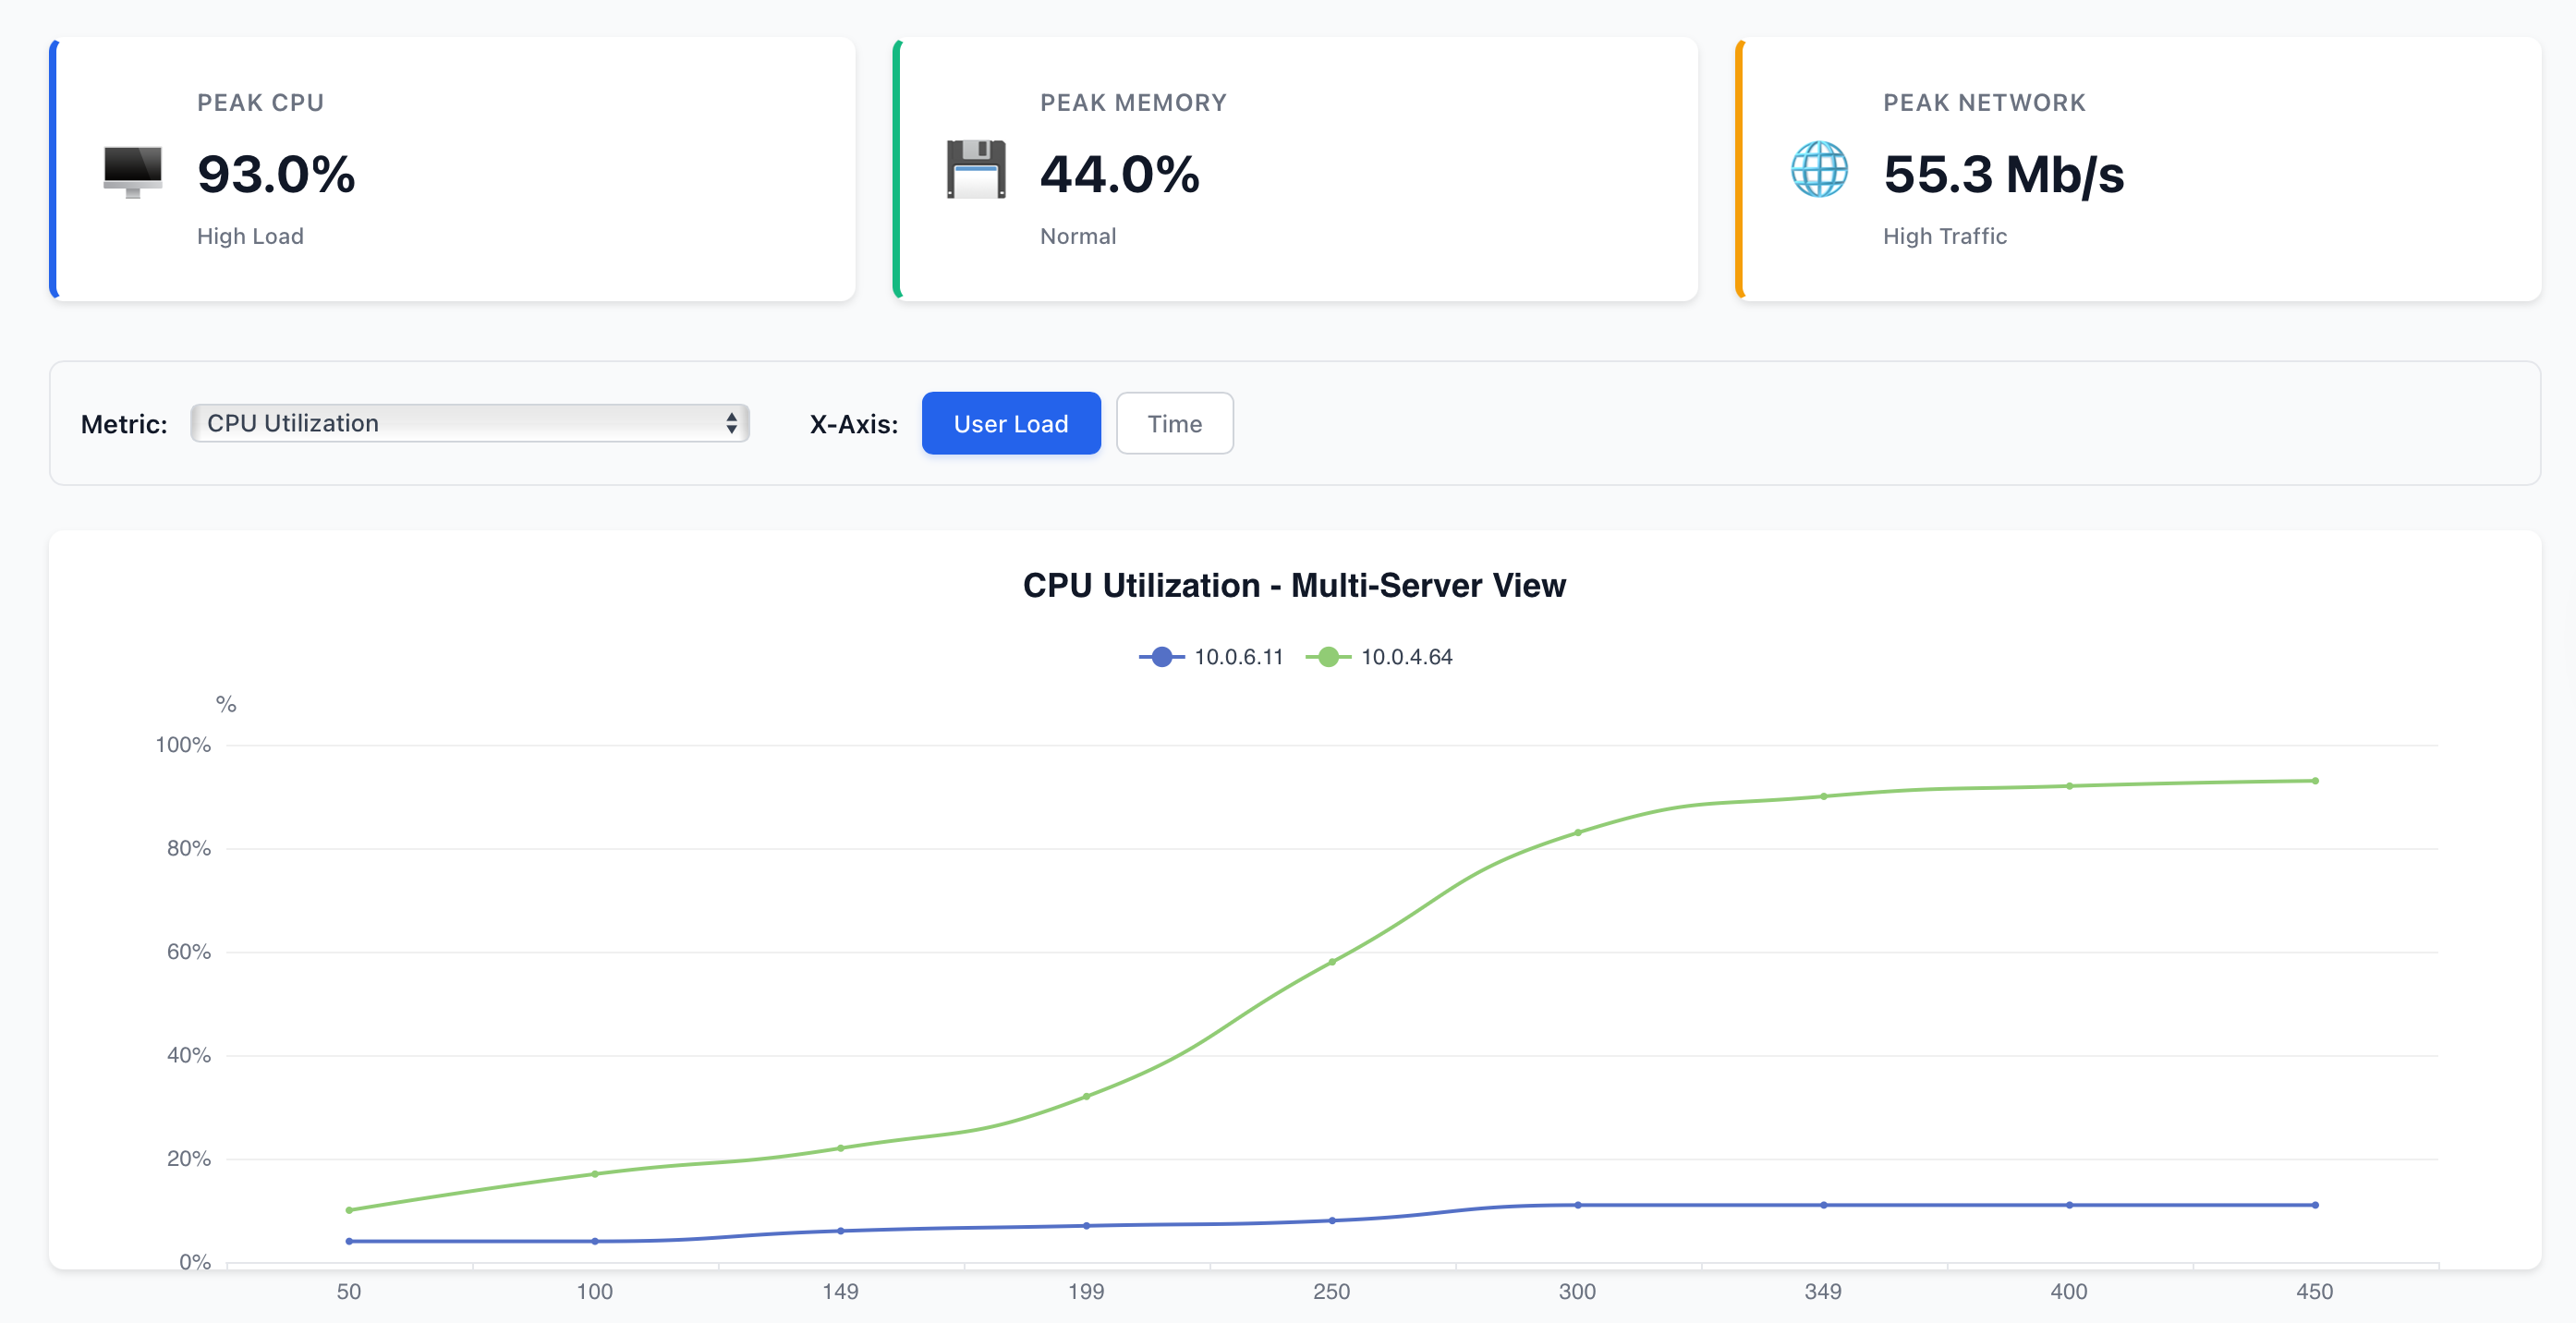
- Health Matrix Visualization – At-a-glance performance health across all user load levels
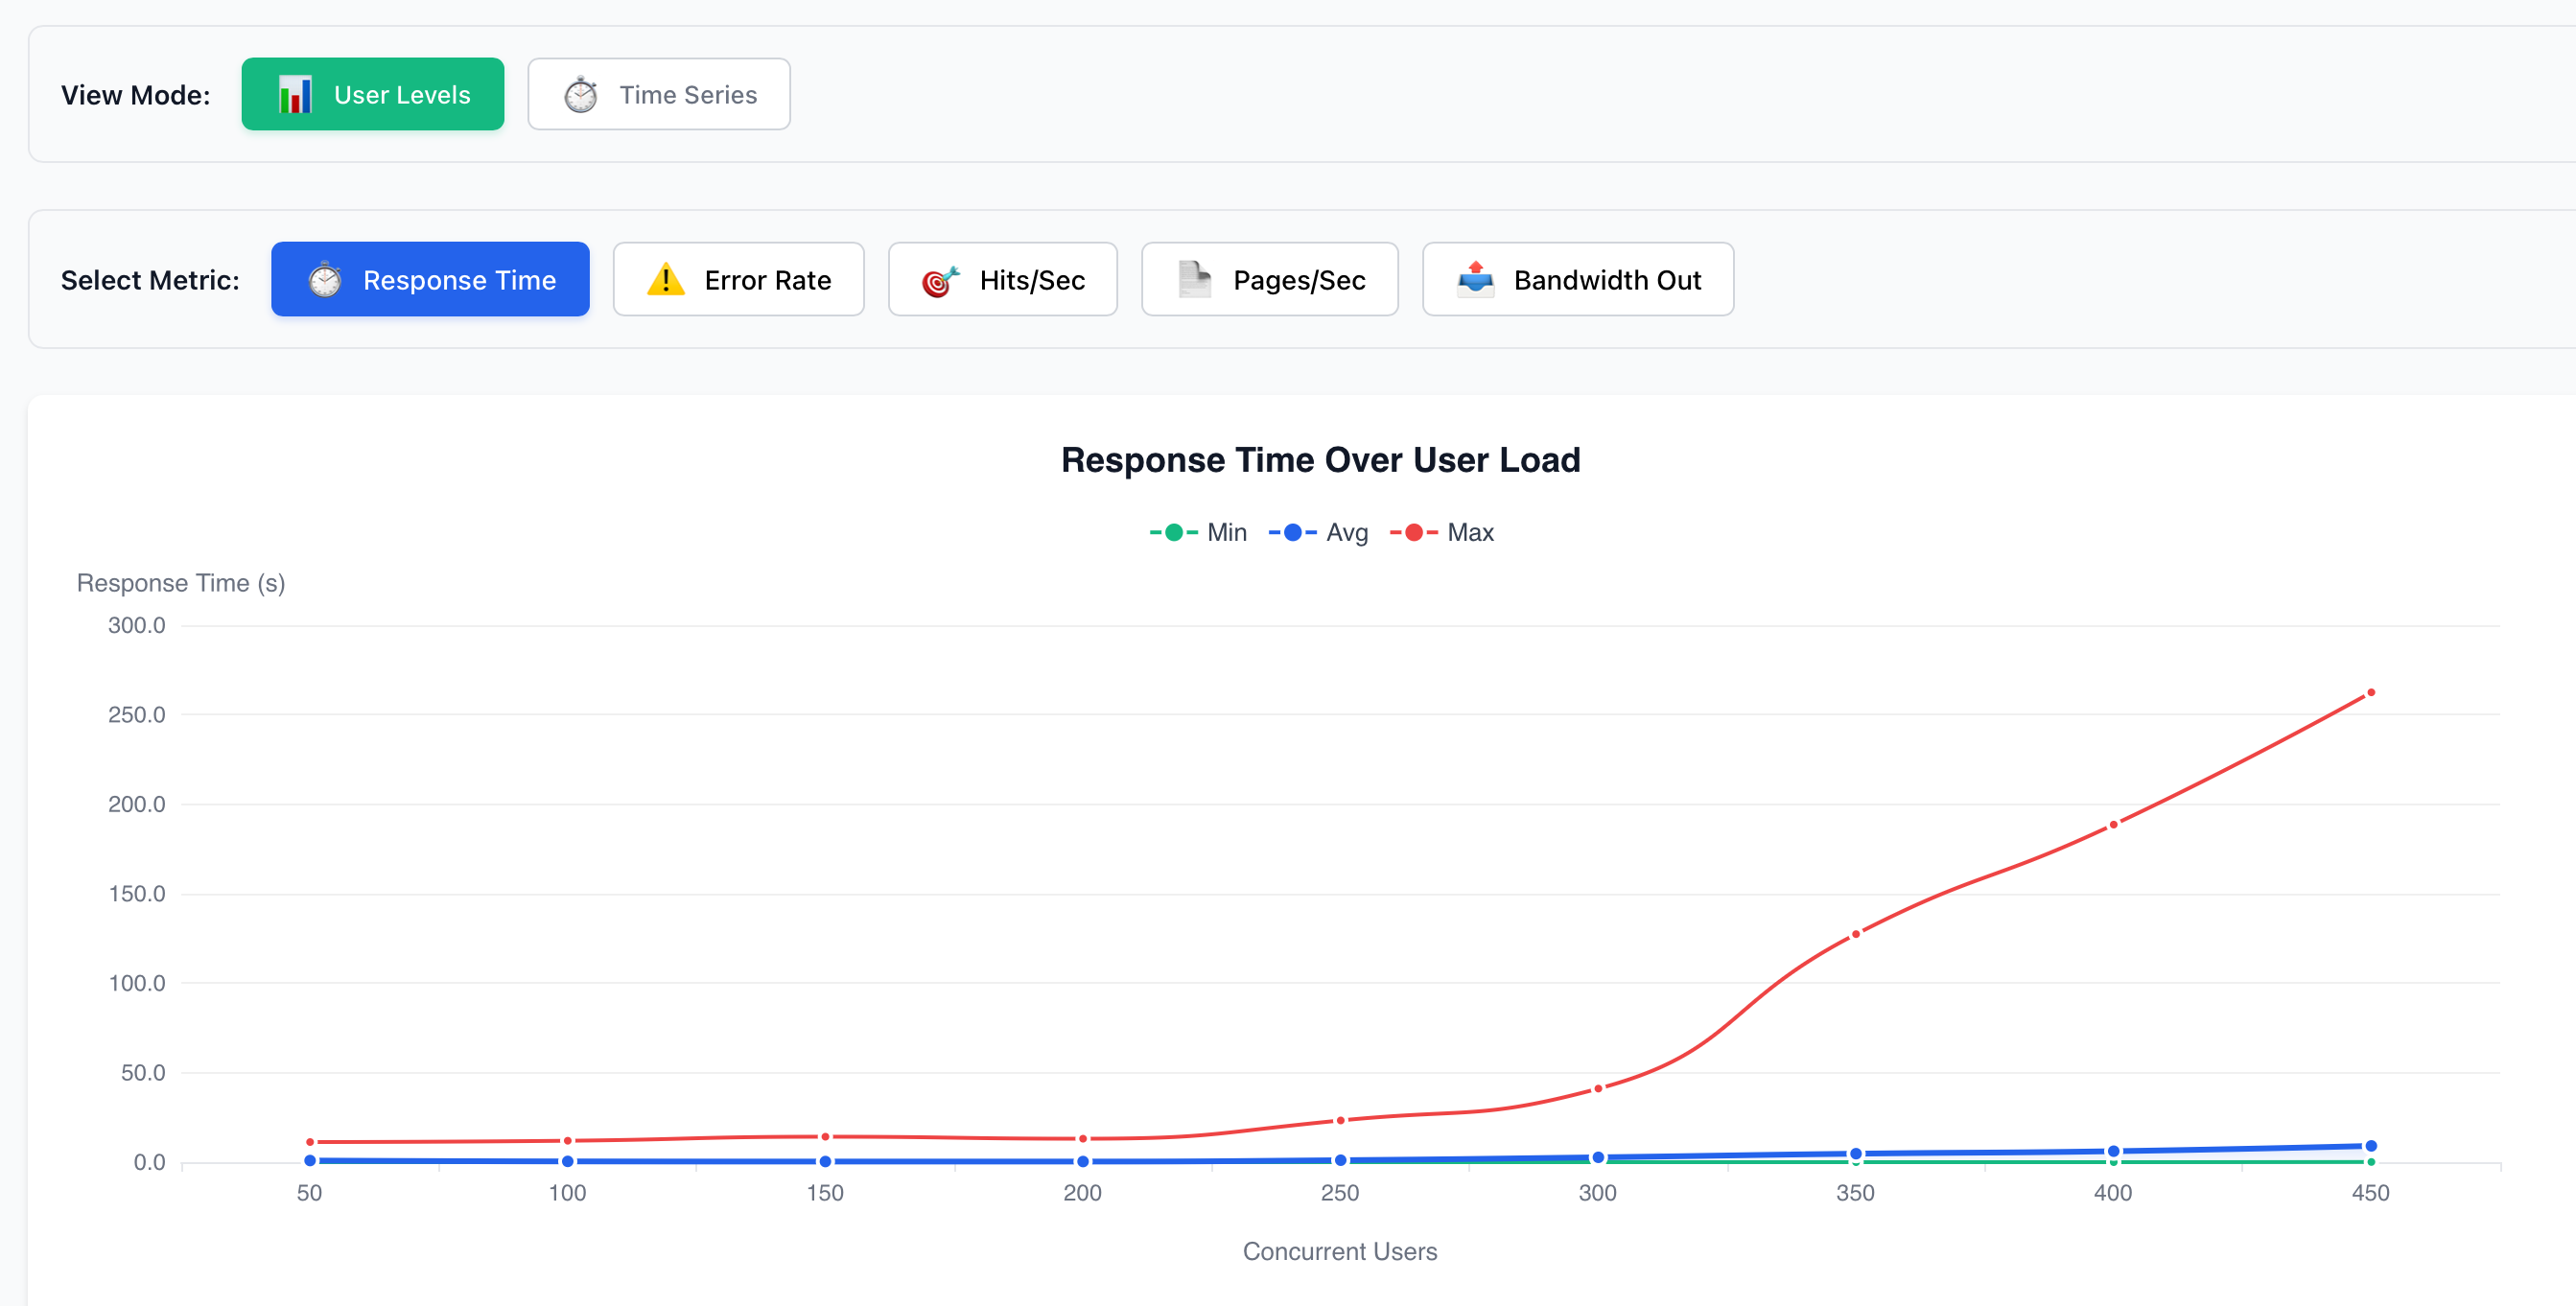
- Interactive ECharts – Zoom, pan, hover for exact values, fullscreen mode
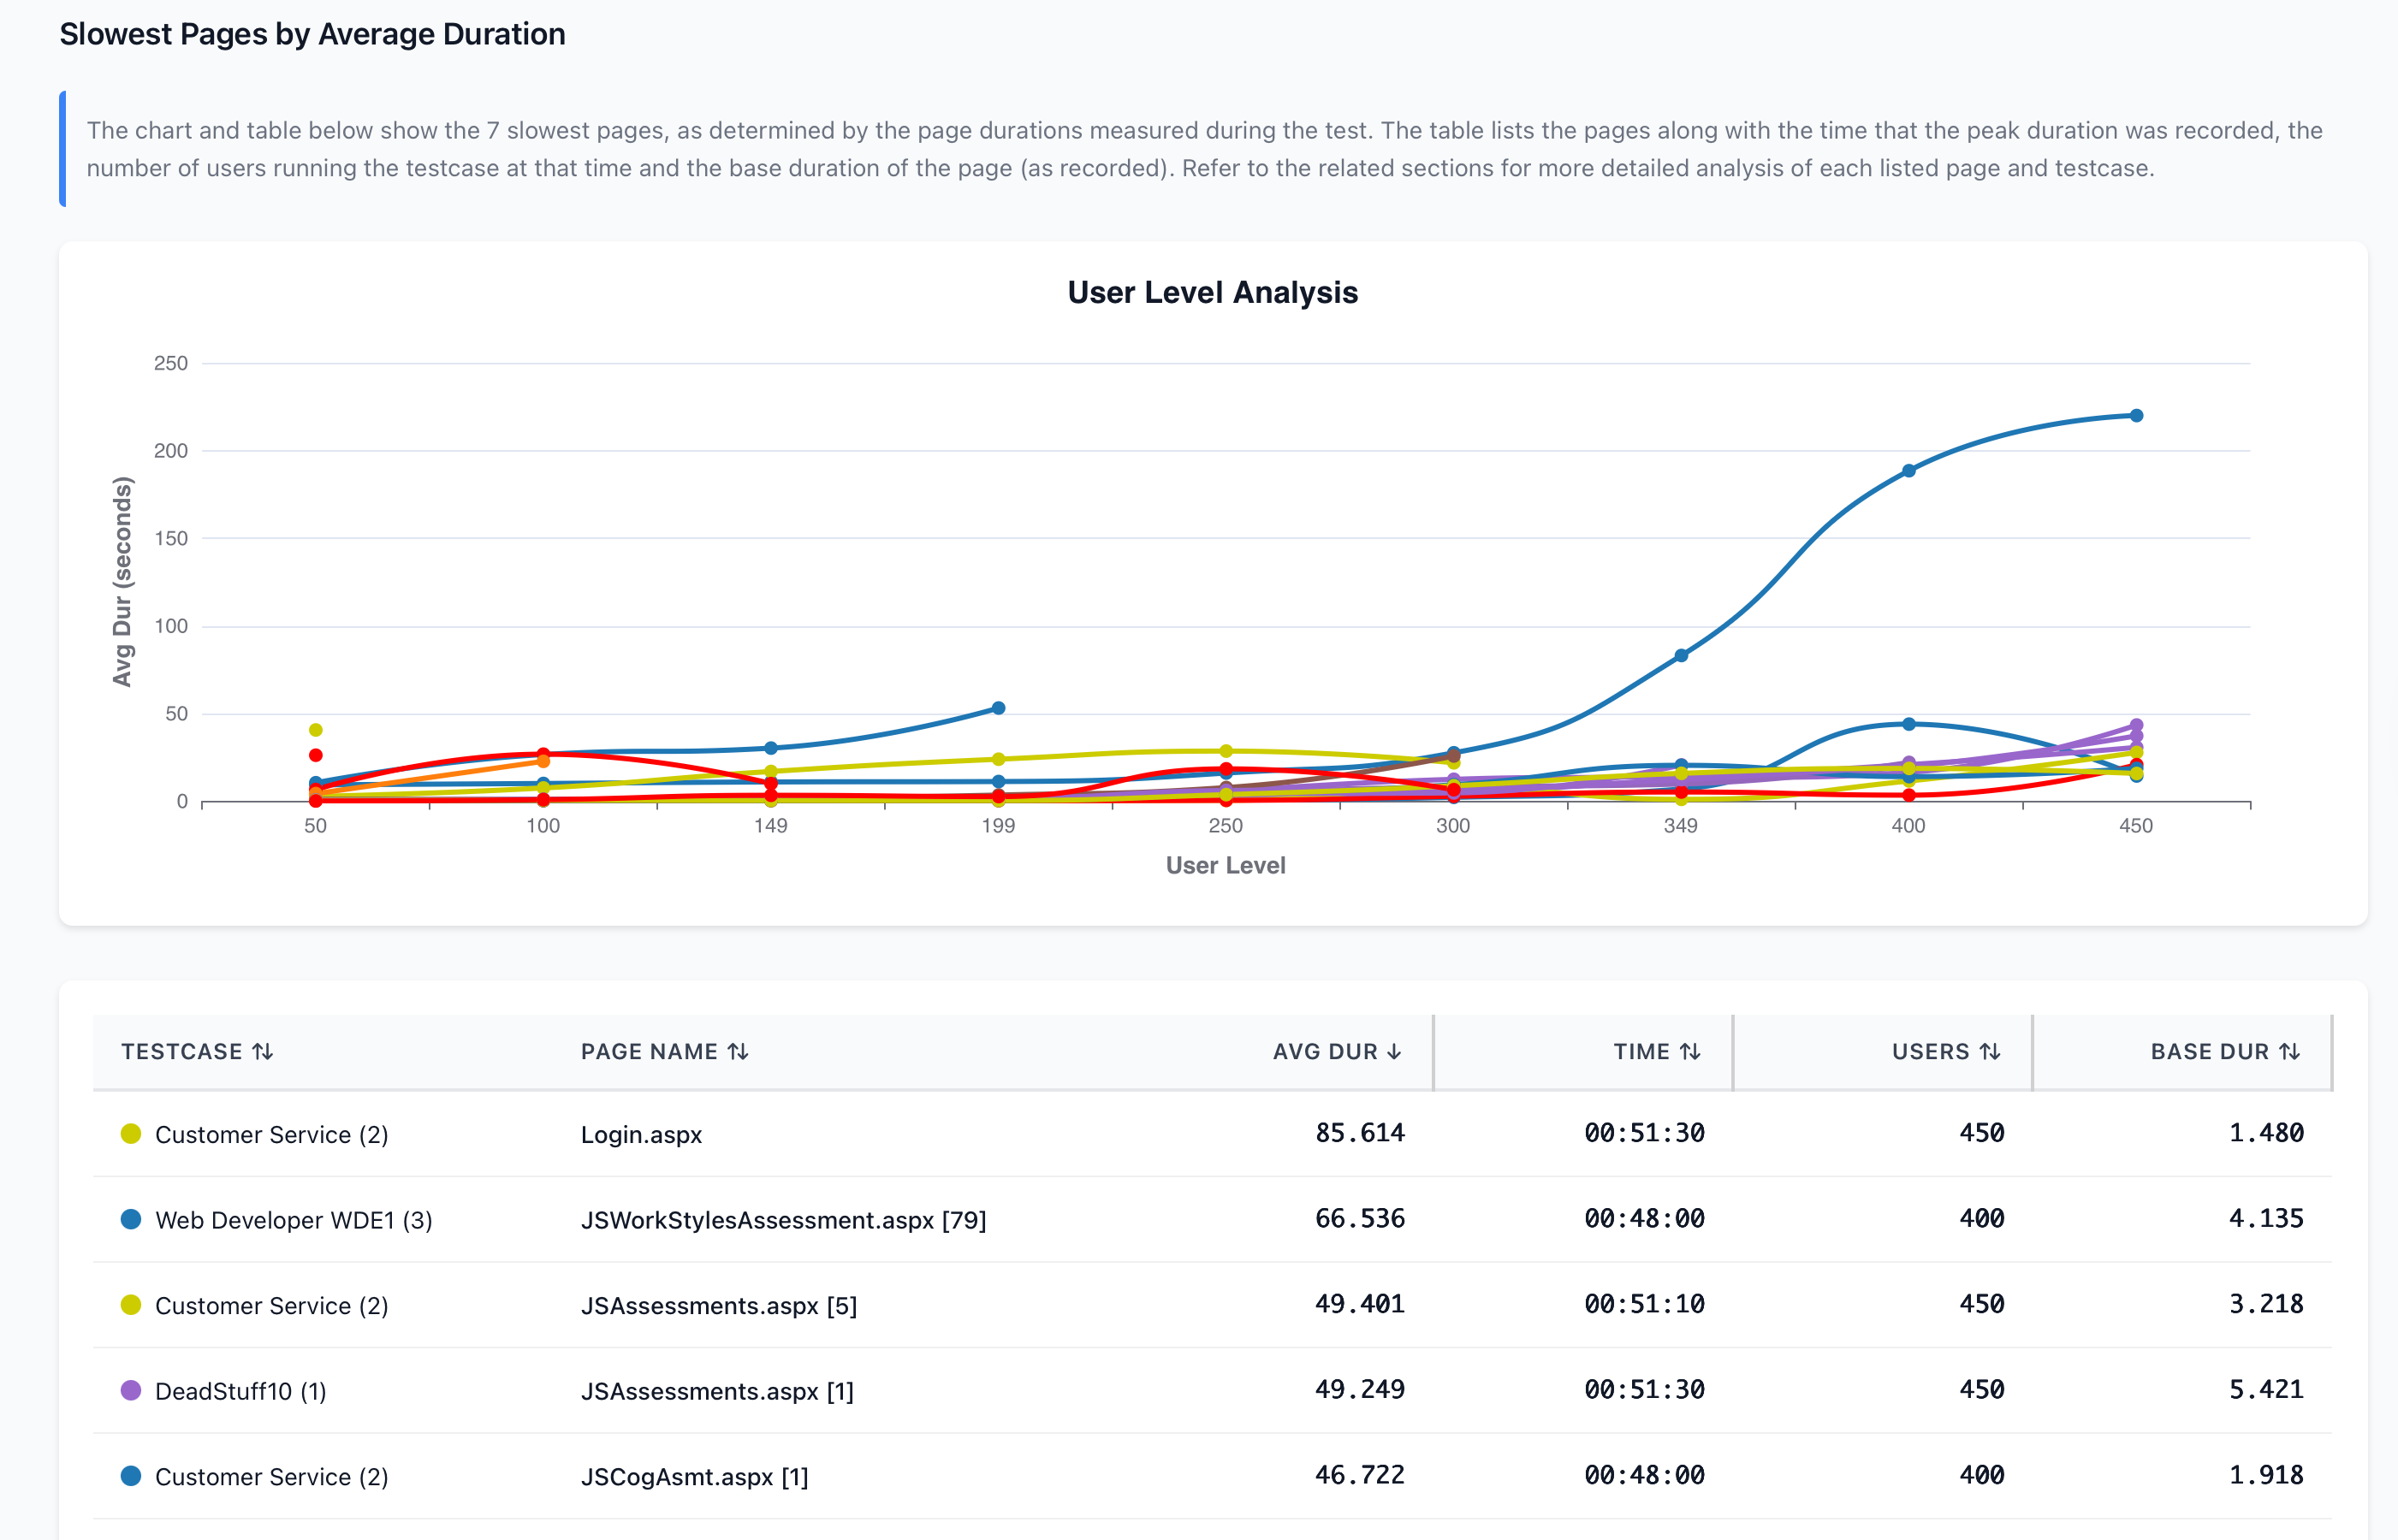
- 5 Key Reports – Test Summary, Health Matrix, Slowest Pages, Error Analysis, Server Performance
- Configurable Thresholds – Customize performance targets for your organization
- Time & User-Level Views – Toggle between different analysis perspectives
Quick Tip: To view your test results in the interactive dashboard, simply right-click on any test result and select “Upload to Portal.” Your entire team will be able to access and analyze the results together.
|
|
|
|
🚀 Getting Started with the Dashboard
|
|
Ready to explore your test results with the new interactive dashboard? It’s easy:
- Run your load test in Load Tester 6.9
- Right-click on the test results
- Select “Upload to Portal”
- Access the interactive dashboard from the portal
- Share with your team for collaborative analysis
The portal makes it easy for your entire team to explore results together, with real-time interactivity and shared insights.
|
|
☁️ Expanded AWS Global Coverage
|
|
Test from 14 AWS regions across 4 continents:
- North America – 6 regions including new Calgary and Montreal
- Europe – Ireland, Frankfurt
- Asia Pacific – Singapore, Tokyo, Seoul, Mumbai, Sydney
- South America – São Paulo
Plus automatic EC2 connection, AWS SDK v2 migration, and improved engine discovery.
|
|
⚡ Massively Accelerated ASM Correlation Engine
|
|
The feature customers love just got up to 50x faster!
ASM (Application State Management) is our intelligent correlation engine that automatically detects and configures dynamic variables—session tokens, CSRF tokens, OAuth2 bearer tokens, and more—eliminating hours of painful manual script configuration. The speed of the old algorithm was N-squared, so the speed slowed down tremendously the longer the test case. The performance is not only quicker on short test cases, but the increase in time is now linear with test length.
In version 6.9, we’ve completely re-architected the ASM detection engine with indexed search capabilities, delivering dramatic performance improvements:
| Test Case Size |
Before 6.9 |
With 6.9 |
Speedup |
| 1,000 transactions |
~2 minutes |
~1 minutes |
24x faster |
| 5,000 transactions |
~10 minutes |
~2 minutes |
45x faster |
| 10,000 transactions |
~60 minutes |
~4 minutes |
90x faster |
What this means for you:
- Analyze large recordings instantly – Multi-hour sessions now process in under a minute
- Iterate faster – Refine correlation rules without waiting for lengthy re-analysis
- Handle enterprise-scale tests – Process recordings with tens of thousands of transactions
- Stay in the flow – No more coffee breaks waiting for ASM to finish
The same 95%+ detection accuracy you trust, now delivering results at lightning speed.
|
|
🎨 Customer Portal Modernization
|
|
- RED theme redesign – Modern visual identity with enhanced charts
- Improved navigation – Grid/list toggle, organization filtering
- High-resolution splash screen – Dynamic version rendering
- Enhanced security – JWT authentication, GCP Secret Manager integration
|
|
📊 Advanced Server Metrics & Reporting
|
- Comprehensive server metrics export with format selection
- Error Details report with breakdown analysis
- Slowest Pages analysis with user-level breakdown
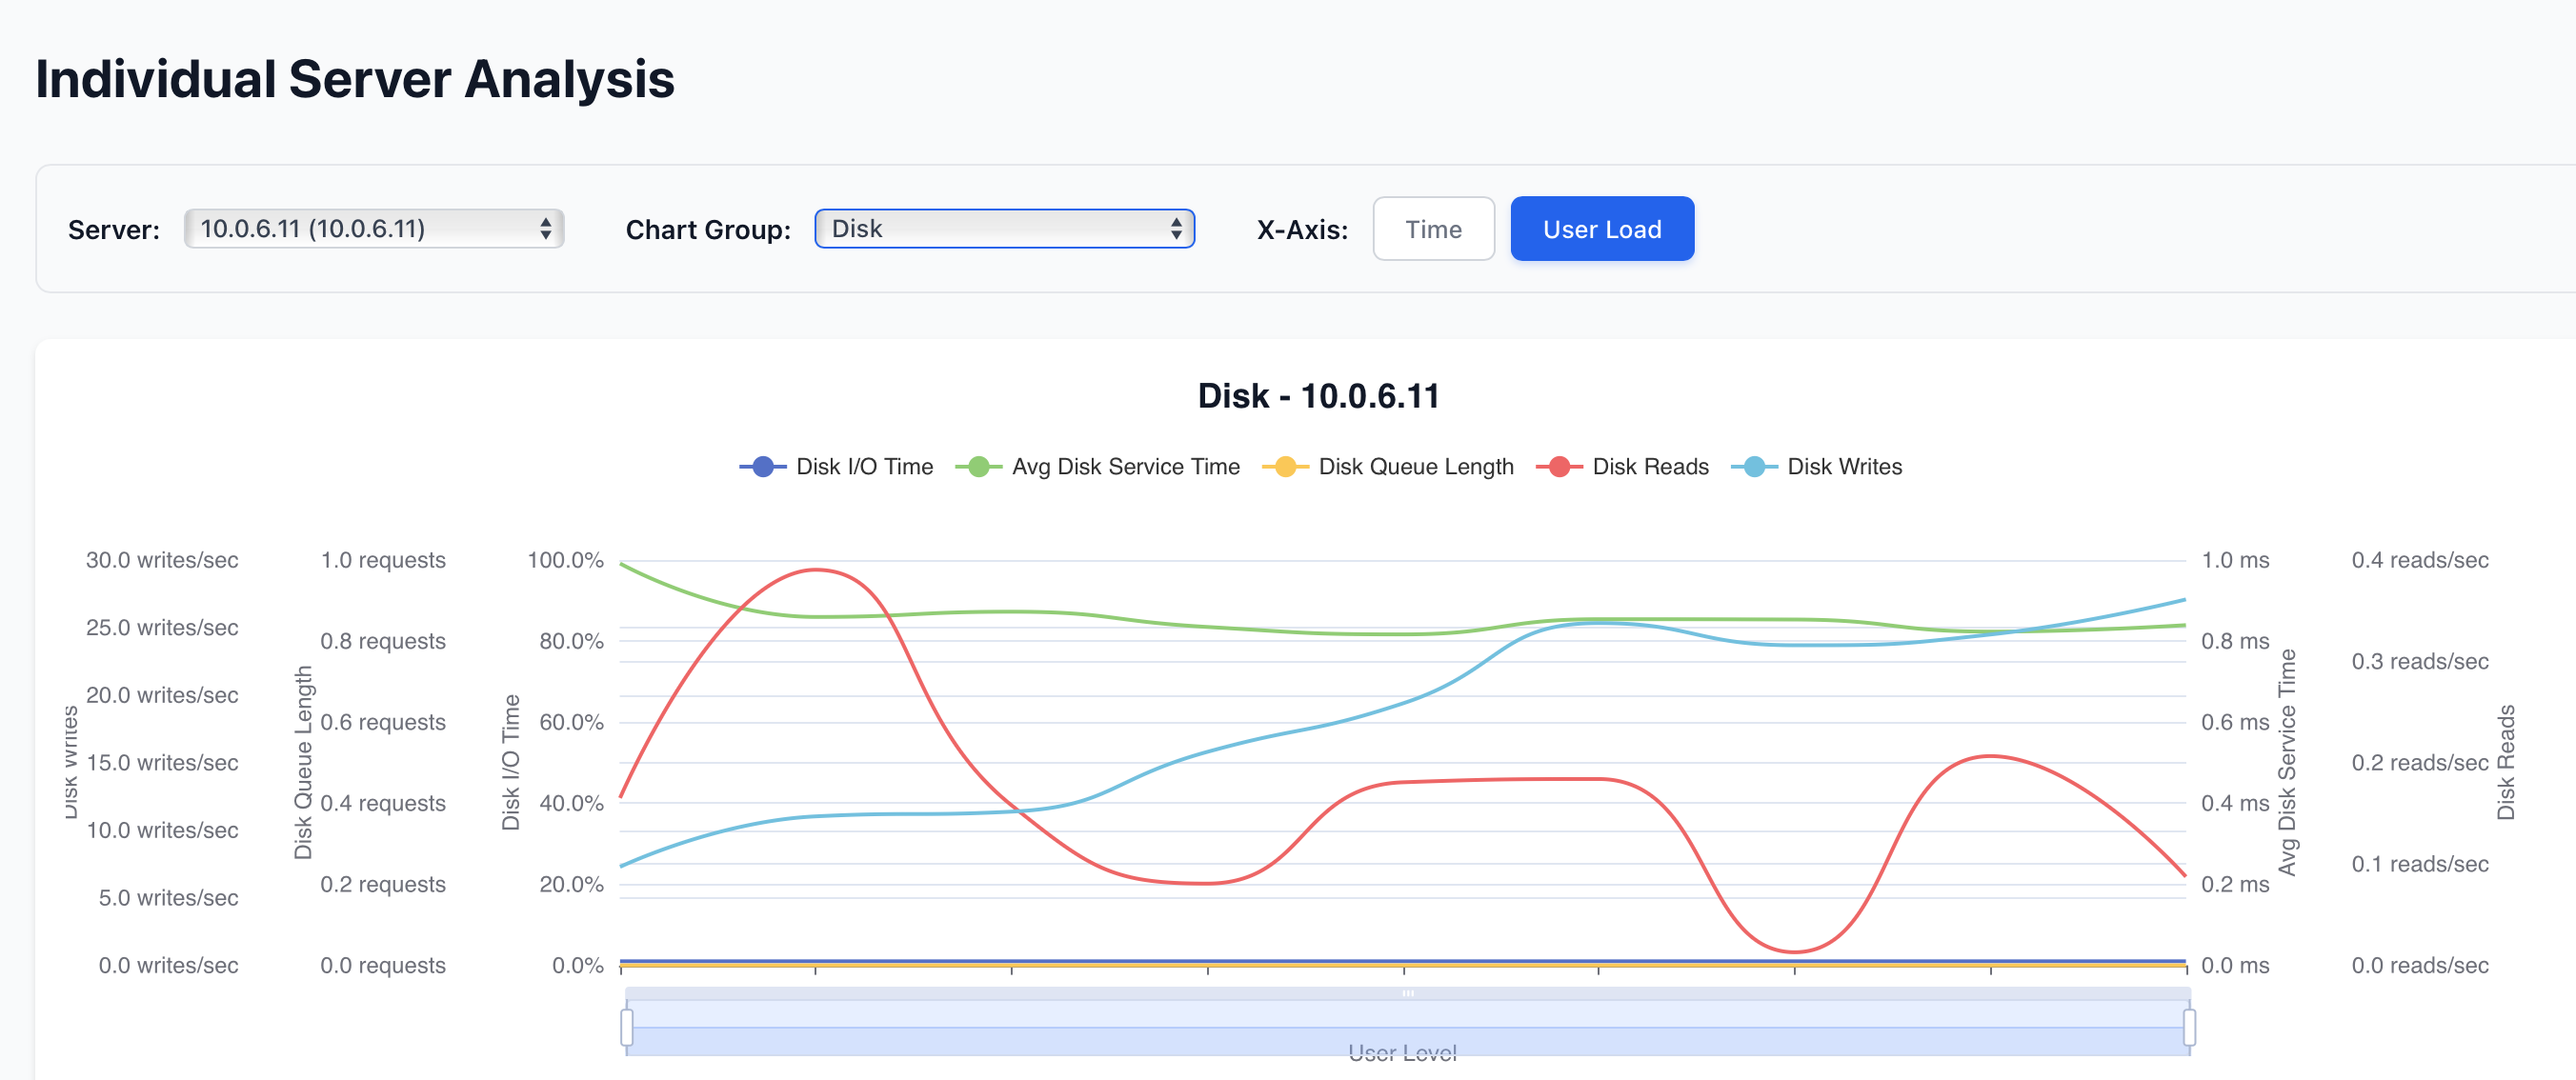
- Individual Server Analysis chart improvements
- Health Matrix with real CPU and memory metrics
|
|
|
|
By The Numbers
|
704
Commits
|
14
AWS Regions
|
5
Interactive Reports
|
559K
Lines of Code
|
|
Ready to Experience the Future of Load Testing?
Questions? Visit our Support Center
|
|
|
Web Performance, Inc.
From static reports to interactive insights
© 2025 Web Performance, Inc. All rights reserved.
www.webperformance.com
|