Measuring Pagespeed and Customer Engagement
Recently we started using Google Pagespeed here at webperformance.com, and one of the cool features you can do with it is split traffic, so half of your customers get no pagespeed, and the other half get pagespeed turned on. With this approach you can actually measure how pagespeed does across your entire site, as well as drill down and look at its effects on individual pages, or even divide performance by country or continent.

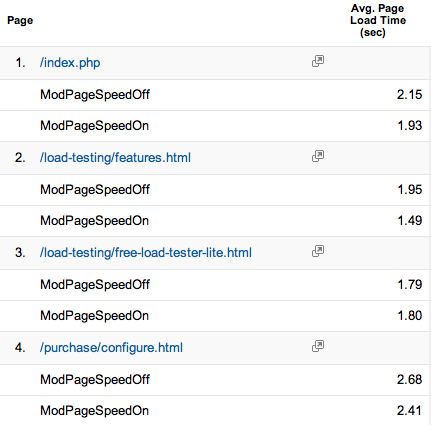
As you can see, the effects on our top four most popular pages were mixed. The most improved page was the list of product features, which saw a 24% speedup. The Load Tester LITE page saw no improvement at all, while the homepage saw a modest improvement of 10%.
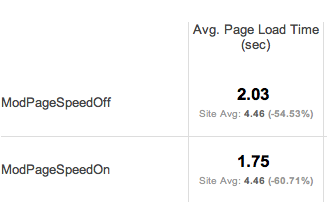
Looking at the performance from the US across the entire site, on the whole there was an improvement of 14%, which isn’t amazing, but is pretty darn nice for basically no work on our part.

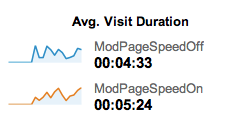
The big question, though, isn’t really what happened to the page load times, but rather, did the improvement in speed help improve any of the other metrics you track on a website such as customer engagement or conversions? In our case, the site was already pretty fast, so I didn’t expect to see much, if any change, and as expected important metrics such as conversions stayed the same. There was, however, an interesting change in how long people stayed on the site:

The amount of time a visitor spent on the site increased by around 20%, and this was consistent on a day to day basis as well; the visitors seeing the pagespeed version of the site hung around longer and read more. I have a feeling that if I’d let the experiment run longer we’d eventually have seen an effect on sales, but after a week I’d seen enough to turn on pagespeed for the entire site.

2 Comments
10 April 2013 matterbury
Did you see any change in bounce rate?
10 April 2013 Michael Czeiszperger
The bounce rate was only .7% different, so essentially unchanged.