User Capacity Analysis
How Many Users?
One of the most important goals of load testing is to find out how many users a particular website can handle simultaneously. For years, Load Tester has been the only product to give a direct, simple answer to that question. In the Load Tester 3.6 release the user capacity algorithm received a major overhaul, making the analysis more configurable, more flexible, and more accurate than ever before.
In this tutorial we’re going to look at some real-world load testing examples, and discover how user-capacity analysis tells us exactly how many users the web sites can handle.
Before We Begin
There are two important points we should consider before we start.
- You must have some knowledge of Load Tester, including navigating through the user interface and running load tests. See this video for a good introduction to Load Tester.
- You should be aware that user-capacity analysis works hand-in-hand with two other features introduced in Load Tester 3.6, performance-goal analysis and user-level analysis.We have videos and tutorials available explaining both of those features in detail, and we recommend watching both of those first. It’s not a hard requirement, but we think you’ll get more out of this tutorial if you have a firm understanding of those other two first.
An Example Where Some Items Fail
Let’s take a look at a load test report. Here’s an example of the test summary section of the report, which is generally the first thing you see. And at the top you can see there’s a line that says “Estimated User Capacity at least 150.”
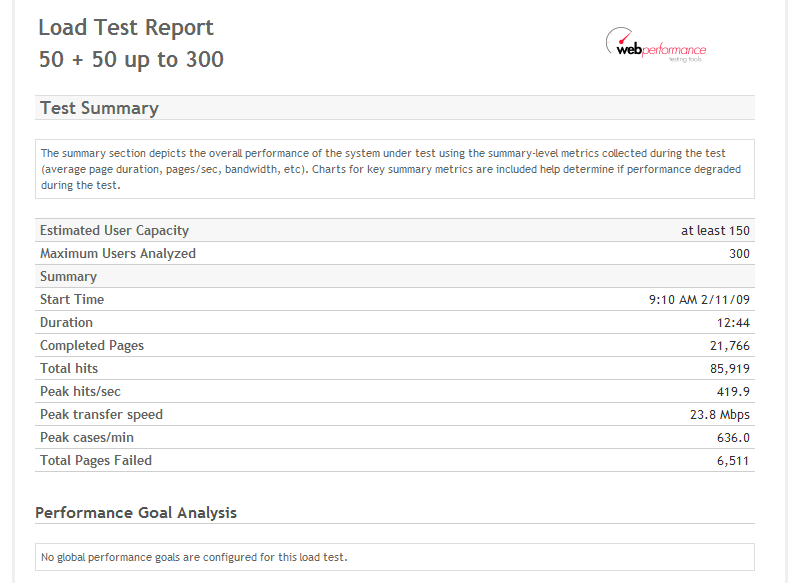
We’ll examine the User Capacity section of the report and learn how the estimate is derived and how to rearrange your testing to help Load Tester produce an accurate estimate. Let’s take a look at a simple load test result. Here’s the User Capacity section:
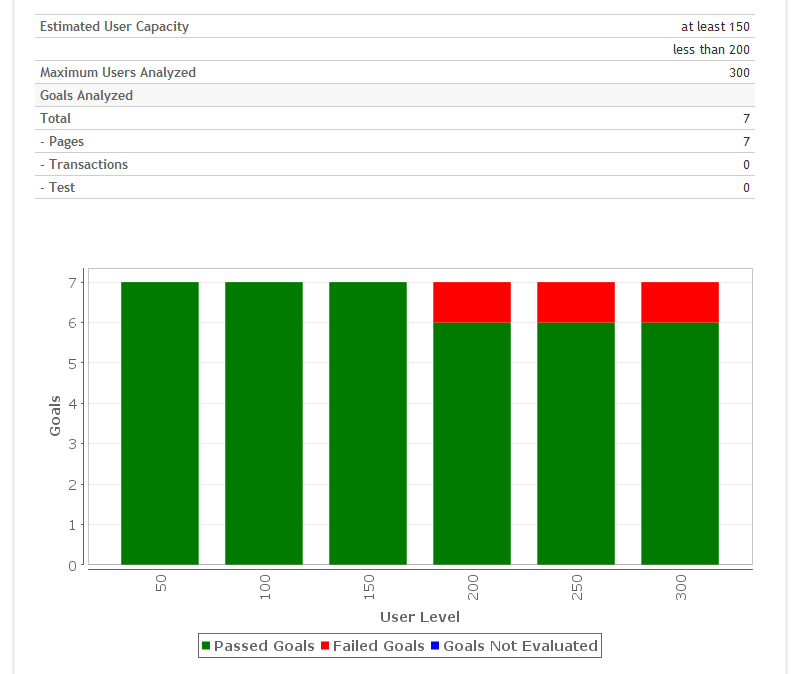
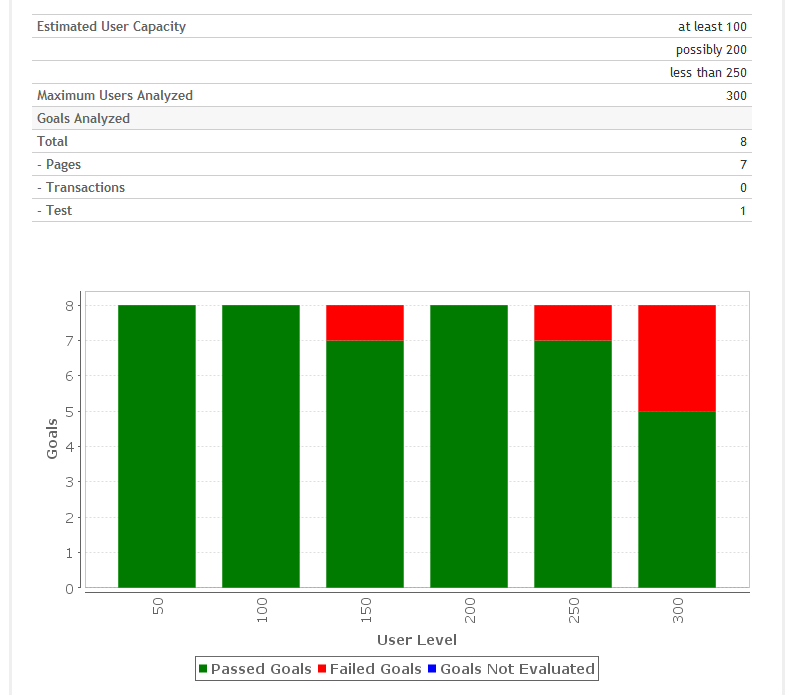
We see that the maximum number of users analyzed is 300, and that seven performance goals were analyzed to come up with the results. The bar chart shows the number of goals on the Y axis. This is the number of items for which the goals were analyzed. The X axis shows the user level. From the key below you can see that the green bars indicate items that passed the goals. Bars with red did not pass. At 200, 250 and 300 users one item that was analyzed failed our goals.
In the estimated user capacity section, Load Tester’s analysis predicts that at least 150 users can be supported by this application. That makes sense, because in testing up to 150 users, everything passed. At a 200 and beyond, everything failed. So we know that the number of users that can be supported is between 150 and 200, but we don’t have a value more precise than that. If we need a more granular result, the next step would be to run another test. Because we know that things start to fail around 200, we might ramp 25 users at a time, or perhaps just ten users at a time, and only up to 200, rather than going up to 300, since we already know that things are going to fail at 200.
An Example Where All Items Fail
Here’s another example that’s nearly as simple.
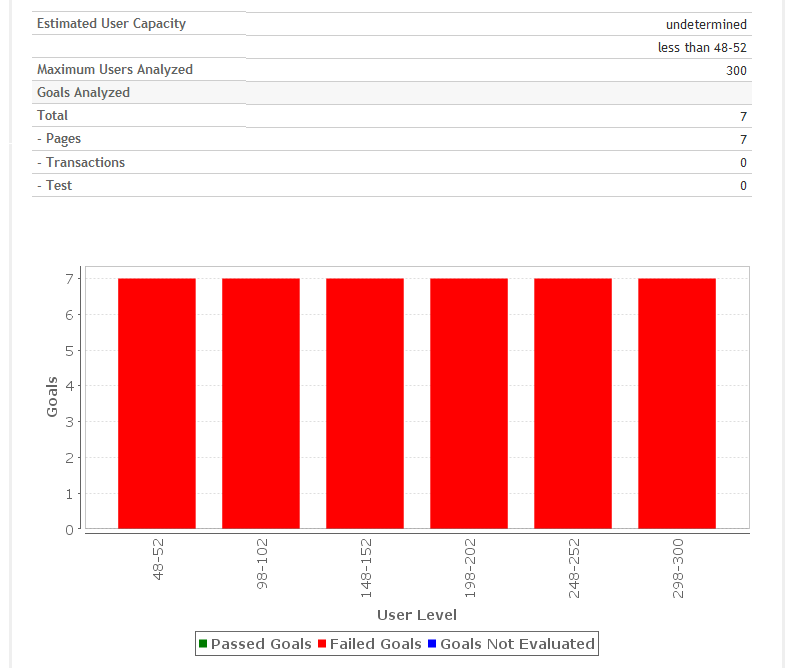
In this test, all the goals failed for every user level analyzed. If we look up at the estimated user capacity, it now says “undetermined” and it’s “less than 48-52” because at 48 to 52 everything failed.
So, the next step in this situation would be to start with a lower number of users and ramp up more slowly. Perhaps you might start at two users and ramp up two users at a time, to somewhere around fifty users, and see if that gets you a more usable result.
An Example Where Some Items Were Not Analyzed
The blue on this chart shows that some items were not evaluated.
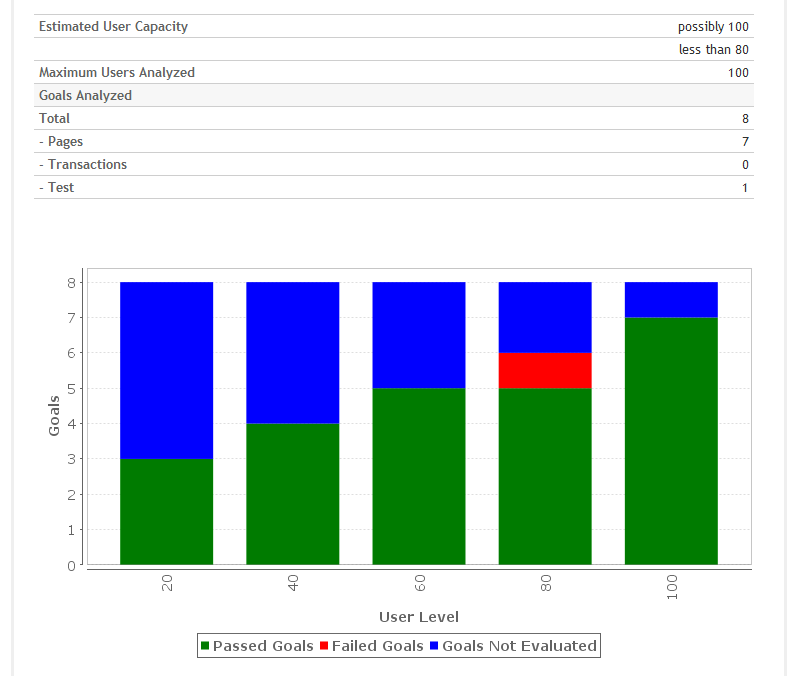
Unvaluated items occurred because some of the pages for this test, pages that had performance goals on them, did not run, or did not complete, at the 20, 40, etc. levels. As a result of this, we cannot actually be sure about the results, because we have incomplete data. So you can see up in the estimated user capacity it says maybe 100 users, because nothing failed at that point, but more likely less than 80, because one goal failed at that level. Is the capacity 100 users? Maybe, but we really need better data, in order to get a more thorough analysis.
What might have happened here? There might be a very long test case, maybe one that takes five or ten minutes, but we were only ramping up like maybe every two minutes, so at lower user levels, a lot of the pages weren’t even being completed yet. The users weren’t getting far enough in the test case to have completed those pages, and therefore we couldn’t analyze the performance at those user levels.
The next step for a result like this would be to increase the test duration, in order to ramp up more slowly.
So we might still ramp twenty users at a time, but we would allow for spending more time at twenty than at sixty. That should get more data for the algorithms to work on, and likely give a better result.
An Example Where All Items Pass
In this example we see all items passing:
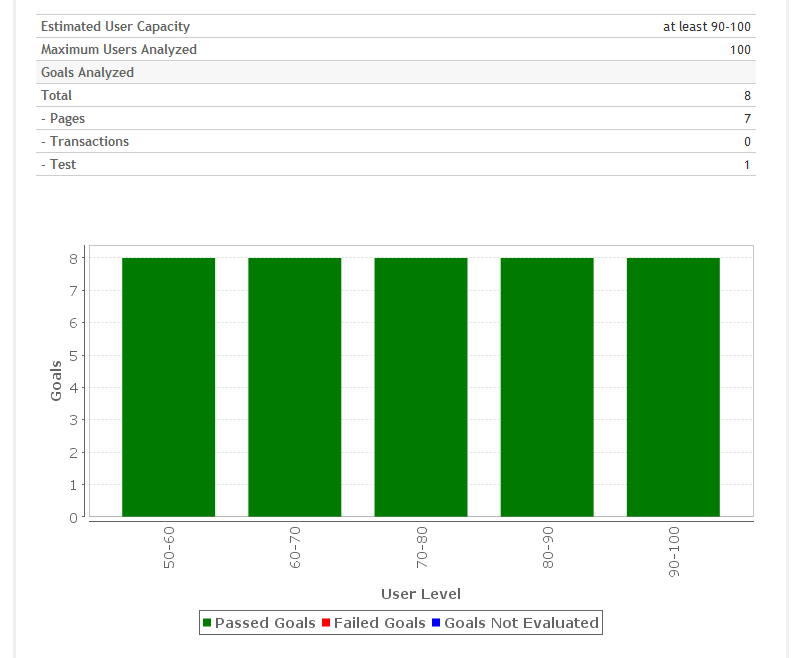
We see that the maximum number of users analyzed is 100, and that eight performance goals were analyzed to come up with the results. In the example here, all eight items for which the goals were analyzed passed for all the user levels that were analyzed, all the way up to a hundred.
Can the Results be Extrapolated?
One of the questions that we frequently get about this analysis is, “Why does it say, ‘At least 90-100,’ instead of telling me exactly how many users?” We often hear a second part of that same question, with a bit of data included, “Look, our server was running only 50% CPU usage, so couldn’t the estimate be doubled, to 200 users?”
Hardware generally tends to scale pretty linearly if it’s the only limiting factor. So you could make a guess and say, “Ok, 50% CPU, and my network, my memory and my disk I/O usage all show good numbers, so we could do 200 users.” But that guess includes the assumption that your software is configured, tuned and designed properly to scale to that level.
In theory, a team consisting of the right kind of people could do an extensive analysis of your software configuration and determine whether you’re going to hit nonlinearities resulting from software.
Is that kind of analysis feasible? Software specifications are generally so complex that it’s virtually impossible. And this is why we do load testing.
Let’s think about software limitations. Suppose in this example that we had a limit of 200 connections on our web server. Because, on average, users use two connections each, shortly after a hundred users we’ll probably start seeing connection failure errors. Software limitations tend to be non-linear. You don’t know where they’re going to pop up until you hit them. For that reason that we cannot make a guess, based on the data, beyond the number of users that we tested and for which we have data to analyze.
Load testing is much more effective than configuration analysis for getting an accurate estimate of load capacity. So it’s important to test your system properly, either up to the limits of your hardware, or beyond the limits of your expected use case. You should test beyond the number of users you expect the system to have once it’s deployed.
A More Complex Example
Interpretation of this case is less clear than the previous ones.
You’ll see that it passed at 50 and 100, and it failed at 150, but the passed again at 200, and started failing again at 250 and 300. So if we look at the estimated user capacity result, we’ll see it says at least 100, because everything passed up to that point, maybe 200, because everything passed there, but we had failures before that point, and we know it’s less than 250, because everything beyond that failed.
The next step here might be to take a close look at our test cases, or to look at things that failed our goals, to get a better idea of why something failed at 150 users but didn’t fail at 200.
What Next?
Now that you understand the user-capacity estimate provided by Load Tester, the most common question is, “Where do I go to improve the performance of the system?” The Performance Goals section of the report will guide you to the pages that failed their performance goals. See the Performance Goals video and tutorial for details.
When his dad brought home a Commodore PET computer, Chris was drawn into computers. 7 years later, after finishing his degree in Computer and Electrical Engineering at Purdue University, he found himself writing software for industrial control systems. His first foray into testing software resulted in an innovative control system for testing lubricants in automotive engines. The Internet grabbed his attention and he became one of the first Sun Certified Java Developers. His focus then locked on performance testing of websites. As Chief Engineer for Web Performance since 2001, Chris now spends his time turning real-world testing challenges into new features for the Load Tester product.