User-Level Analysis of Performance Results
The User-Level Analysis offers an alternate presentation of data in the Load Test report: it summarizes the data relative to the amount of load being applied to the servers. This is in contrast to the usual approach of plotting metrics against time. Load Tester can automatically plot charts of test results against the applied user level, saving you effort and helping you gain a better understanding of the results. Let’s see how this is done.
This tutorial assumes that you have some knowledge of Load Tester, including navigating through the user interface and running load tests. See this video for a good introduction to Load Tester.
Setting Up User-Level Analysis
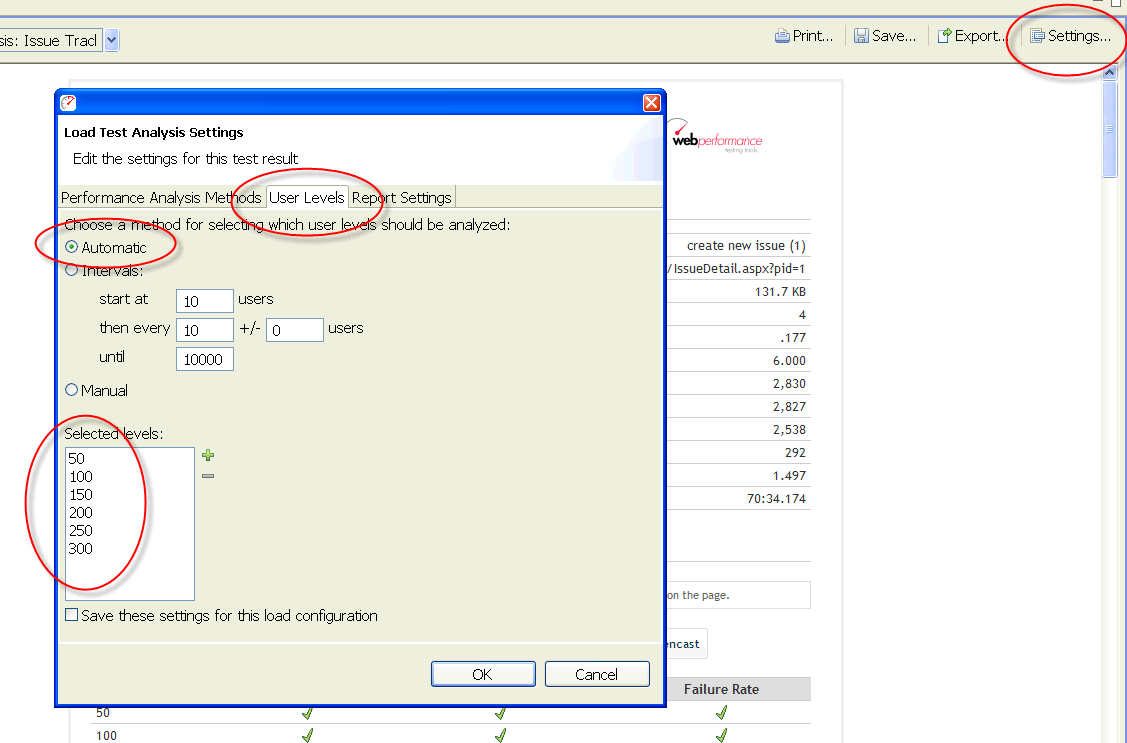
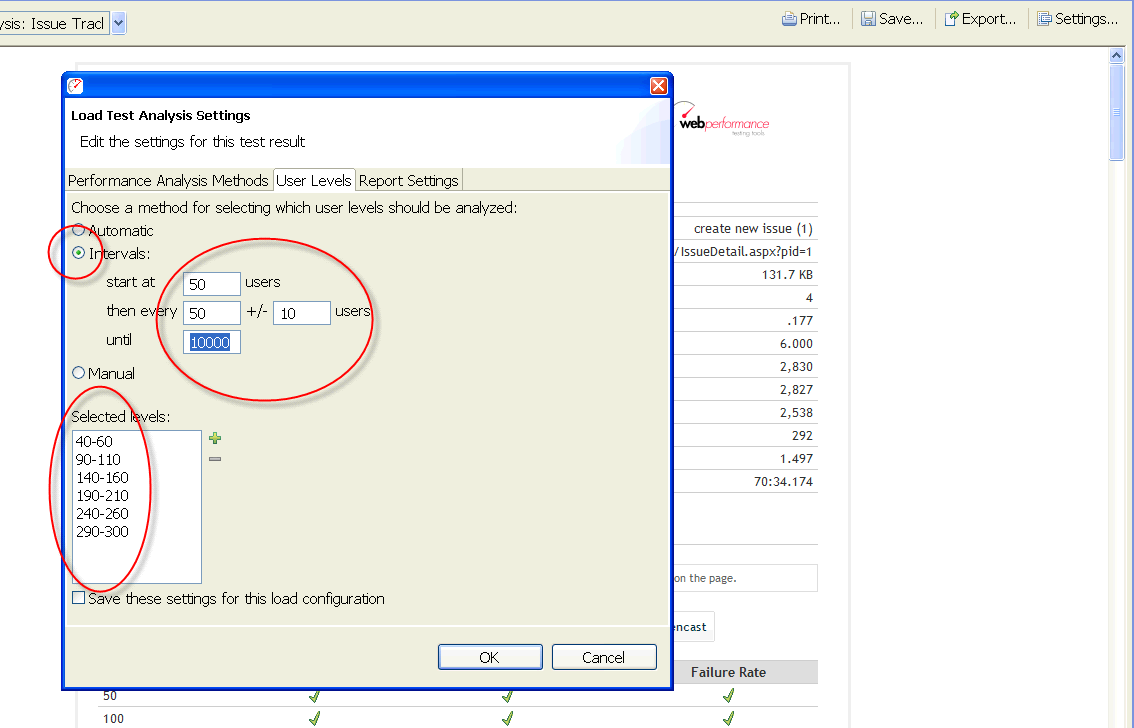
Before we begin, let’s just mention that to set up user-level analysis you use the Settings dialog as shown below.
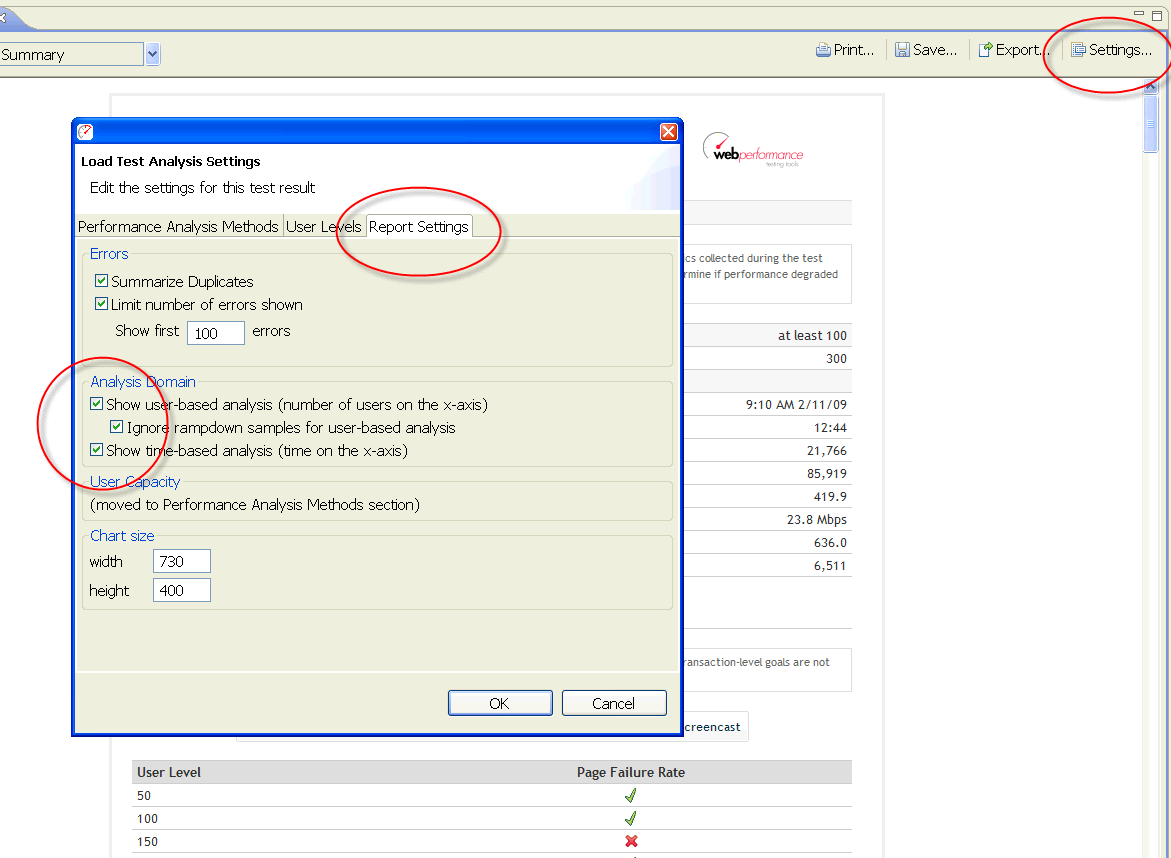
You have a choice of two major sections, the time-based analysis, showing all the charts with time on the X axis, and the user-level section, where the user level is on the X axis. The check boxes let you turn user-based or time-based analysis on or off, giving you whichever method you prefer. Because we are comparing user-based analysis to time-based analysis, we’ll leave both boxes checked for this demonstration.
Comparing Time-Based and User-Level Analysis
In the load test report shown here we see the number of users plotted in blue on the chart. The load starts at 50 users, and ramps up, 50 users at a time, to 300 users. If, for example, our target user level was 250 users, we would be particularly interested in the data in the range between 200 and 300 users, as shown in the highlighted area.
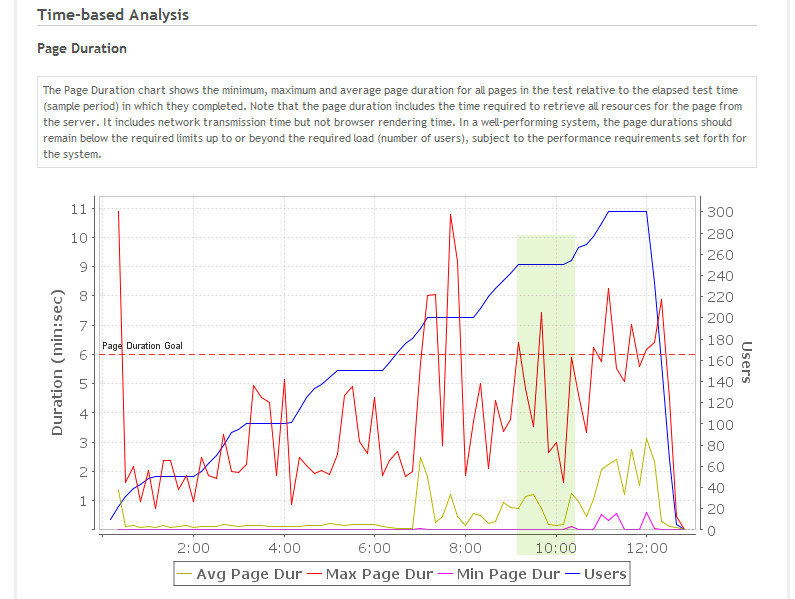
The chart gives us a feeling for what the overall average page duration was when 250 users were running, but for an exact number you would expect to do some mathematics, based on the detailed statistics that Load Tester presents. Indeed, early versions of Load Tester, as well as most other load-testing tools, require that you make some calculations to get that data.
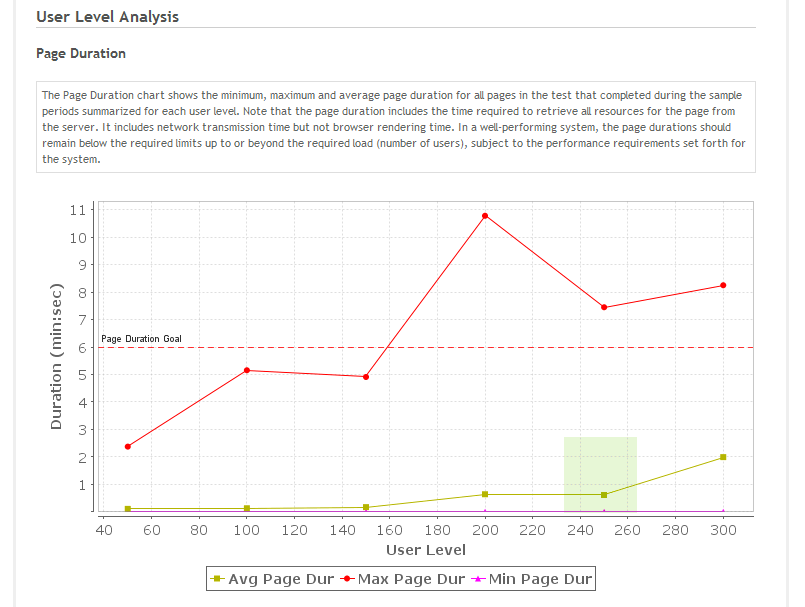
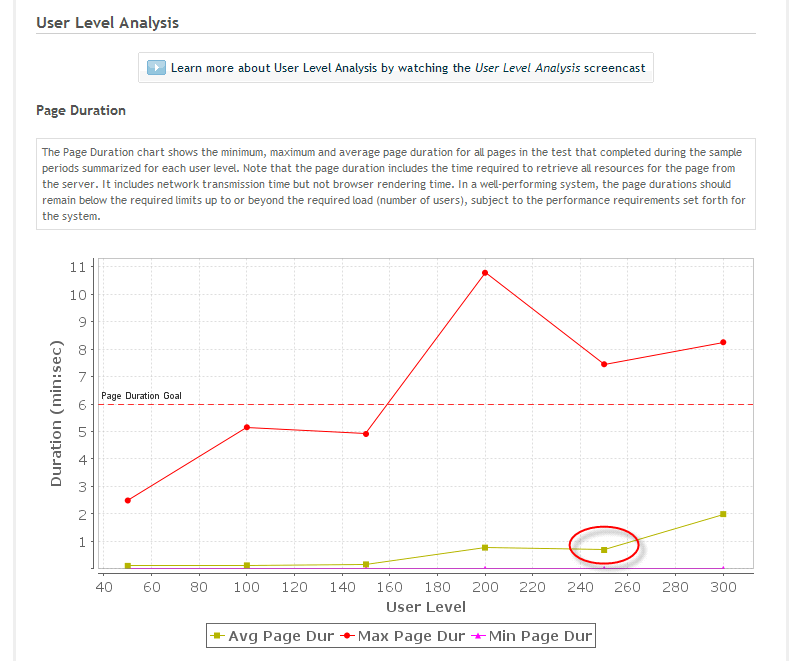
In Load Tester’s current releases, many sections of the report perform these summaries automatically. The page-duration chart below shows user level on the X axis, rather than time as on the previous chart. There are only six data points here, rather than the great number of them in the previous chart. The data points are at 50, 100, 150, 200, 250 and 300 users. The data point for average page duration for 250 users, shown in the highlighted area, is around two-thirds of a second.
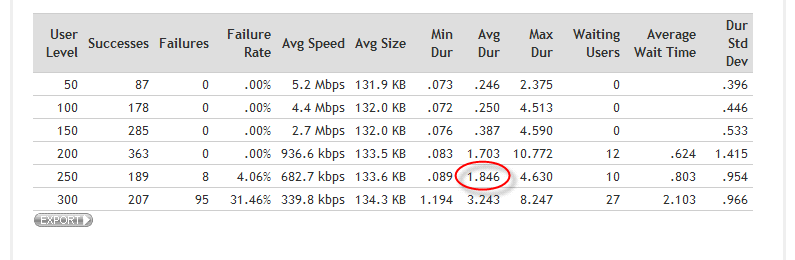
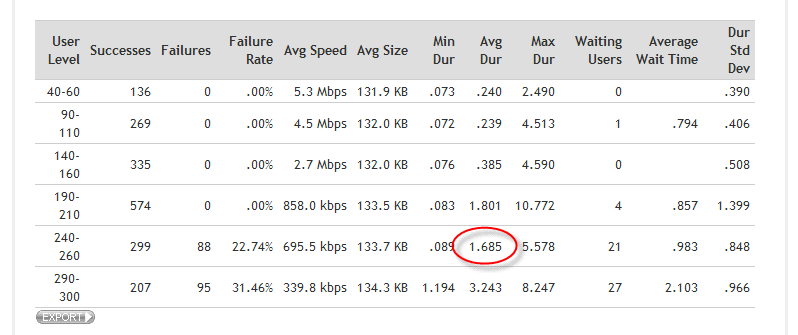
In a table at the bottom of the user-level analysis we can see all the metrics summarized for us at each of the relevant user levels:
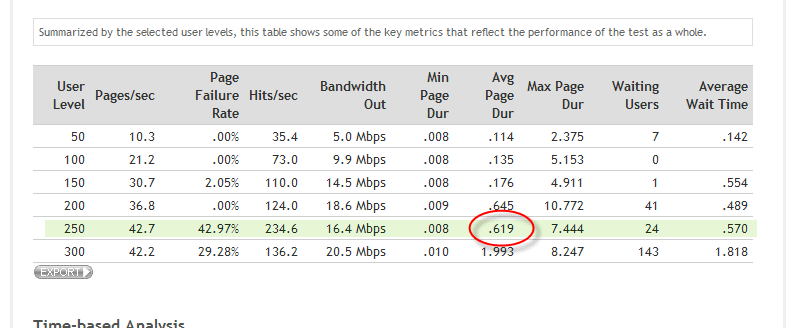
Here we can very easily see that our average page duration at 250 users is about six tenths of a second.
User-Level Analysis for Individual Web Pages
Up to now we have been looking at the Test Summary section of the report, which has the highest-level metrics.
We can also drill down to the individual web page and transaction levels. We find them by looking in the Web Pages section of the report. Here we’re finding a page named Issue Tracker – Issues [2].
![Picture of Page Analysis for Issue Tracker - Issues [2]](https://www.webperformance.com/load-testing-tools/blog/wp-content/uploads/2009/12/PageAnalysisIssues2.png)
Let’s look at user-level analysis. This is the same chart that we just looked at, but it’s for one specific page:
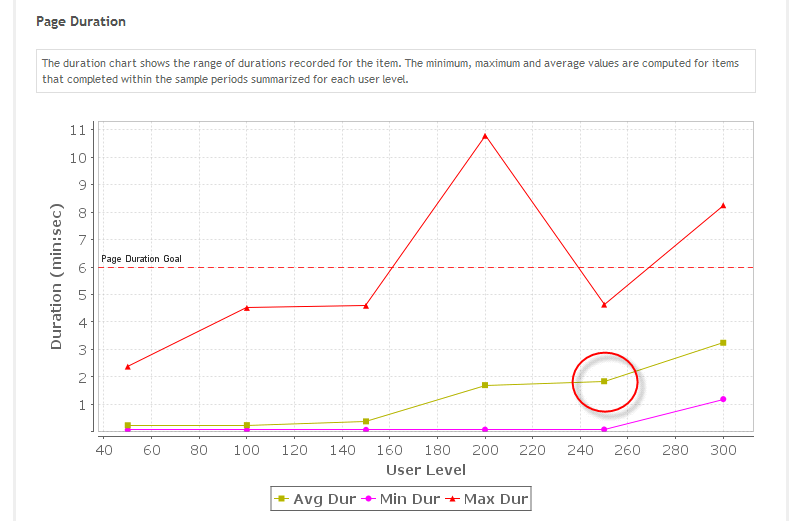
We can see that our average page duration at 250 users looks like it’s just shy of two seconds, and again we can scroll down to get the exact numbers off the table. We can see that 1.8 second, roughly, is our average for this particular page.
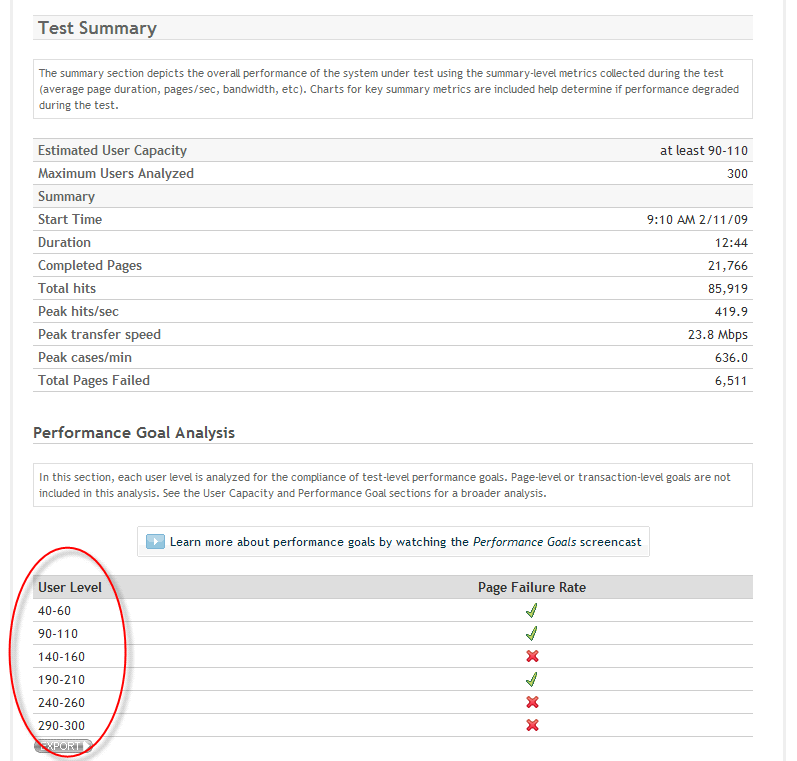
Let’s look at the top of the page-analysis section. This is the performance goal analysis area, and Load Tester has analyzed the performance goals for this page against its performance. It’s done this for each of the user levels that we’re analyzed elsewhere.
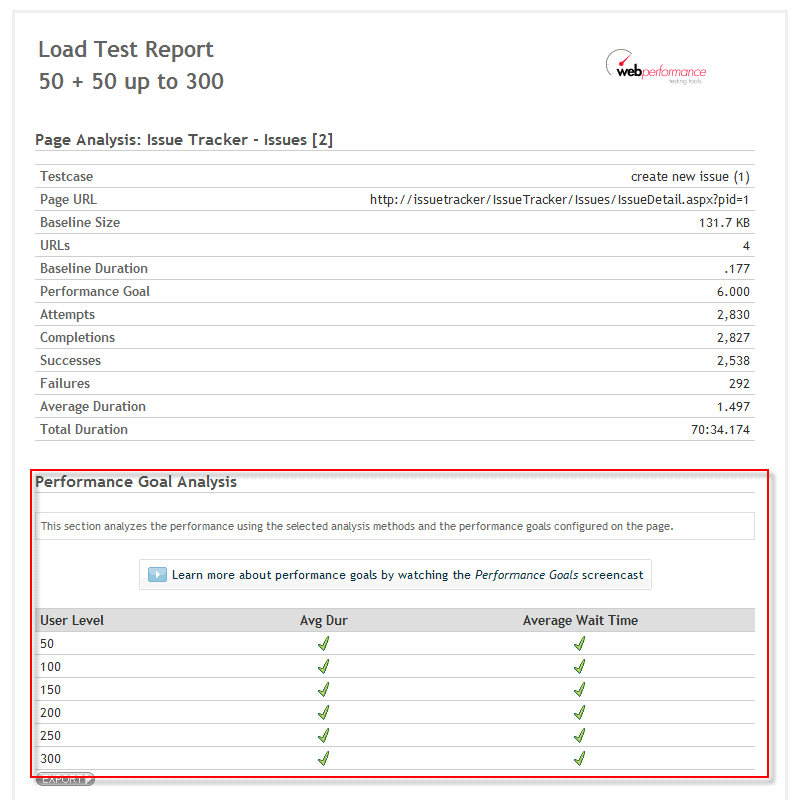
The Performance Goals Analysis video explains performance goals and the analysis that goes with them in much greater detail than we have seen here. It’s worth noting, however, that the user levels for performance-goal analysis are the same as those for the user-level analysis section that we have just examined.
Automatic Selection of User Levels
When we first open a load test report, Load Tester automatically select the user level to analyze, based on the test configuration. In many cases that’s going to be correct, but occasionally it won’t be. So we have the ability to customize those settings. So again we return to our report settings dialog, go to the user-level tab, you can see here that we have several options for choosing the user level.
Manual Selection of User Levels
Under automatic, you can see that it’s chosen 50, 100, 150, etc. You can also choose a manual method, and that allows you to add and remove any user level that you want, and if that user level was encountered during the test it will be analyzed. There is also an option for intervals. For example, we could say that we want to start at 50 users, and then every 50 users plus or minus 10.
Using the intervals gives us a slightly larger range of user levels. If we then accept these settings and return to our report, still viewing the results for only the Issue Tracker – Issues [2] page, we can see that our data has varied slightly because we are including a little bit more data in the analysis.
If we move down to the table, we again get the exact numbers, and can see the average of roughly 1.7 (rather than 1.8 as before) for this particular page.
Note that these user level settings apply to the entire test report, so if we return to the summary section we’ll see those user levels that we just selected applied there as well.
Summarizing Performance Goals
User levels, besides being used in the sections that we have just examined, are also used for summarizing all the performance goals for the test. Here is a summary of all the goals we analyzed in the performance-goals section at each of the user levels.
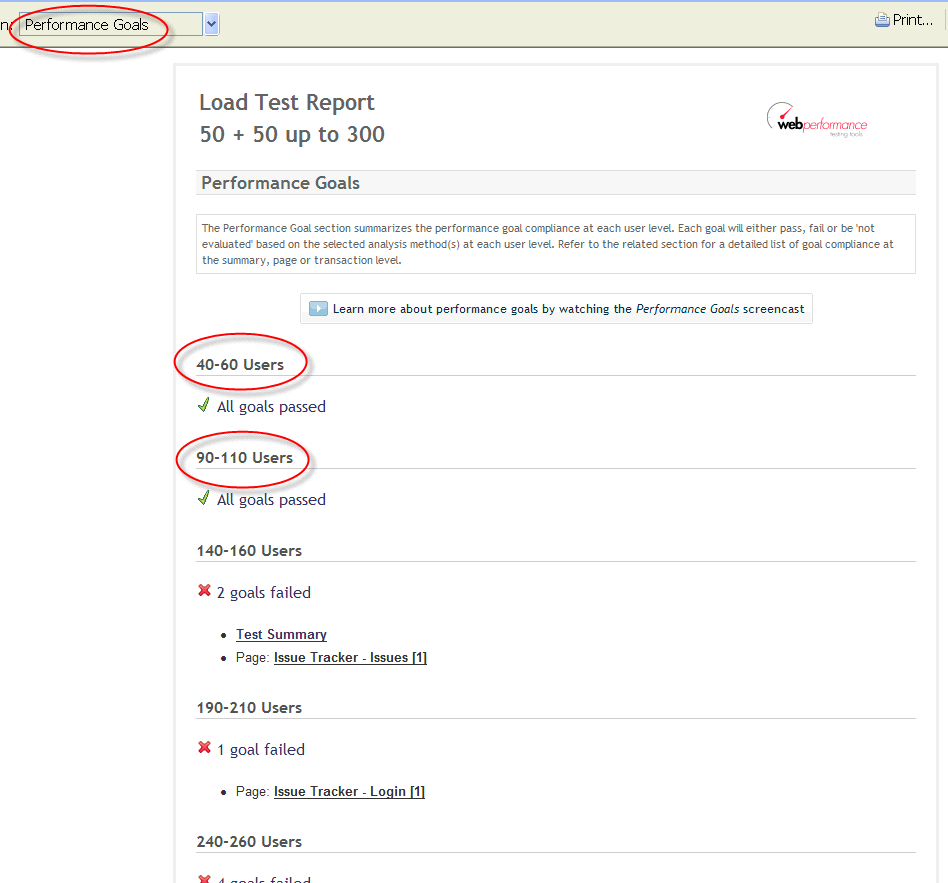
Again, for more about performance goals, see the Performance Goals Analysis video.
Estimating Capacity
Load Tester also applies user levels in the user capacity section, where it analyzes the data and estimates the user capacity of your site.
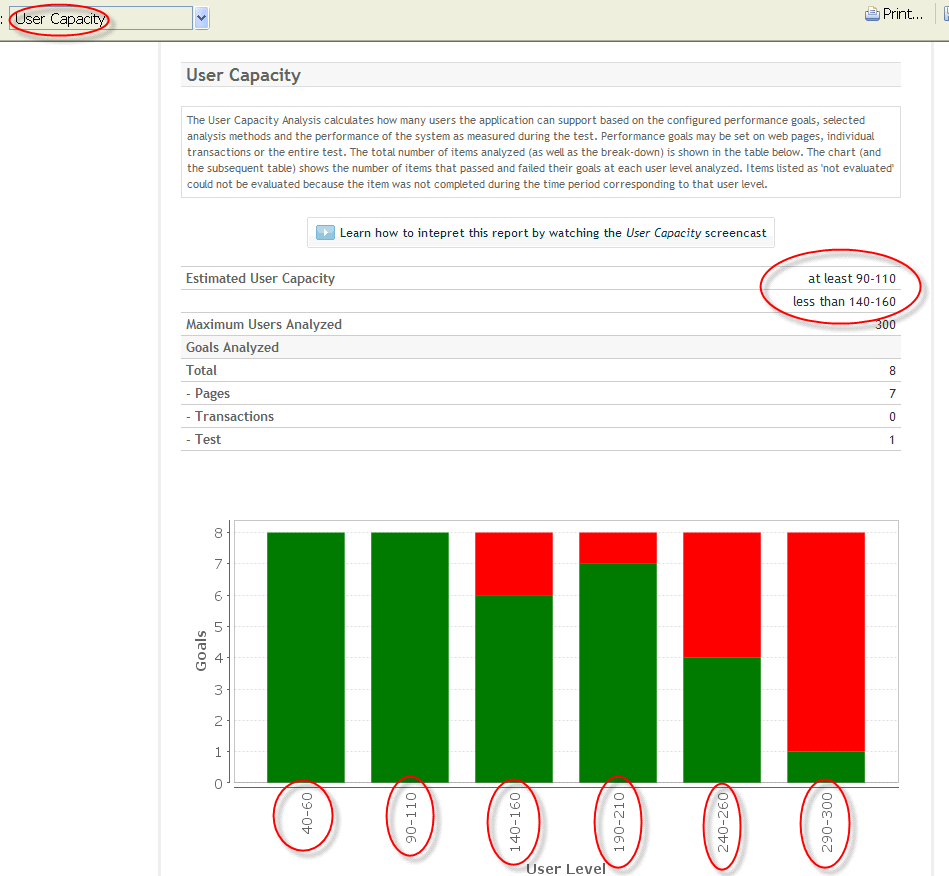
For a more complete explanation of user-capacity analysis, how it works and how to estimate your site’s capacity, see the User Capacity video.
When his dad brought home a Commodore PET computer, Chris was drawn into computers. 7 years later, after finishing his degree in Computer and Electrical Engineering at Purdue University, he found himself writing software for industrial control systems. His first foray into testing software resulted in an innovative control system for testing lubricants in automotive engines. The Internet grabbed his attention and he became one of the first Sun Certified Java Developers. His focus then locked on performance testing of websites. As Chief Engineer for Web Performance since 2001, Chris now spends his time turning real-world testing challenges into new features for the Load Tester product.
Get web performance news
Occasional load-testing tips, performance-engineering notes, and product updates. No spam — unsubscribe anytime.