Estimating Load test ramp-up times
Once a user has a testcase ready to run a load test, there are a number of questions that we have to be prepared to answer. How long should the test be run for? How many users should be added at each step, and how quickly should new users be added to the test?
In order to begin answering some of these questions, I began experimenting with some new graphics options to gauge the quality of a load configuration run with Load Tester 3.6. These graphs highlight where and when activity is happening during a test by plotting the number of Completions for each page, at each point in time. Black is used for no activity, white for the most activity.
What Do I Want?
Load Tester simulates users working their way through a workflow. A Load Test can contain multiple workflows, and each workflow should simulate a sequence of events that a real user is likely to follow. Estimating test durations and ramp rates is more complicated when we have multiple workflows, so let’s just assume we have one workflow. In this simple case, if we are watching the live site with a fixed number of concurrent users, then we would expect that there will be an equal amount of activity at each page in the workflow over a sufficiently long period of time.
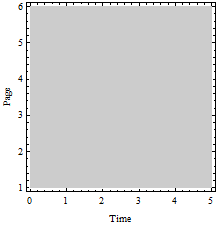
This is just a solid color, as we are dealing with a fixed number of users over time, and the users are evenly distributed across all pages of the site. Obviously, real users will be more chaotic, but this is what the activity might average out to. As a thought experiment, if our server experienced a peak load window regularly one hour every day, then if we averaged all of those windows together, we would expect the user distribution to normalize evenly across all pages (again, assuming that users will follow only one fixed sequence of steps in their workflow).
For a Load Test, we also want to know not only if the site can support a fixed number of users, but also, if it can’t, how many users did it support? To this end, we really want to analyze a step-ramp.
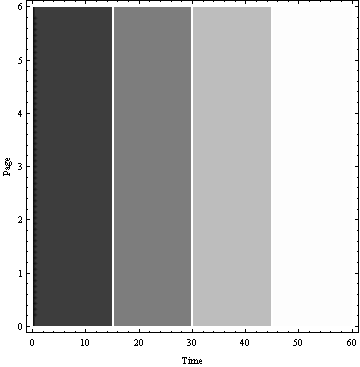
For most workflows, this is impossible. New users will need to work their way past the homepage, through the login, and further before they can start hitting the next pages. Let’s assume that our testcase requires 5 minutes before the user can reach the end, then we would like a ramp-up window of 5 minutes to increase our users.
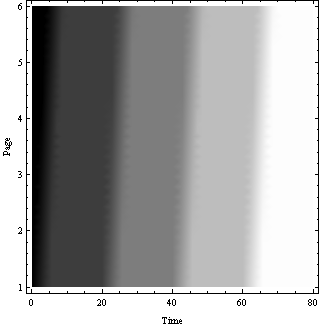
Ramping Styles
Load Tester offers three ramping options: VU Start, Users, and step period. The VU Start has two options: Immediate and Random. The Immediate option adds users instantaneously at each ramp cycle.
![]()
Where δ is the Kronecker delta function, and w(t) is the time relative within the ramp window, and is given as
![]()
Where ![]() is the period of the step function, and I is the specified increase in users.
is the period of the step function, and I is the specified increase in users.
This is obviously used for special cases, and is not generally representative of real users. The Random option distributes the user startup over the first 1 minute in the step period:
![]()
By packing new users into a 1 minute window, we can force the application to respond to short bursts of activity that simulate our more chaotic user distribution patterns. But, if we want our test to be representative of real users, our test user distribution pattern should also normalize to a predictable distribution.
For the rest of this discussion, I’ve collected test results from a few load tests, configured to run a 5 minute testcase up to approximately 250 users in each scenario. By changing the ramp-up period and test duration, we can create very different user distribution patterns. An important distinction should also be noted – these tests do not push the server to degrade in performance. If page durations began to increase, the testcase duration would increase, and estimating the result on the user distribution becomes much more complicated if possible.
Continuous Ramps
In a continuous ramp, we are continuously adding users throughout the test. In Load Tester, this means adding users at every one minutes interval.
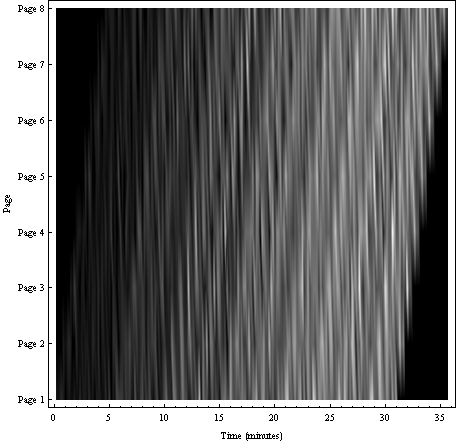
Obviously, we don’t want to analyze data prior to the first 5 minutes as being representative of the site – as it takes that long before the test can even begin applying pressure on the last components of the site. Even more enlightening, let’s zoom in on the 15 to 20 minute range.
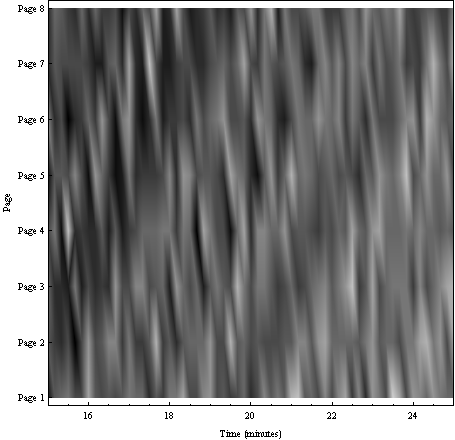
Looking at this graph from the vertical axis, we can tell that not only is the load increasing under time, but at any given point in time, the test is configured to apply proportionally greater pressure to pages earlier in the testcase than pages farther along in the testcase. That fact by itself isn’t all bad – plenty of sites expect a greater share of load to appear on the homepage than other pages. But, the pressure difference applied to each page has become a function of the think-time between those pages. Tests that need to rely on greater pressure being on initial pages more than others will usually be better served by modeling their load test with more than one testcase / workflow.
In Phase Ramping
So, to simulate a real test, most of us will want to us a step function for our ramp, so that at each step we allow enough time for a fixed number of users can walk the entire testcase, allowing us to observe how the entire site behaves with that fixed number of users. If we know that our testcase will take 5 minutes, we might try setting our ramp-up rate to 5 minutes, which ensures that users will have walked the site at least once before our next step in load.
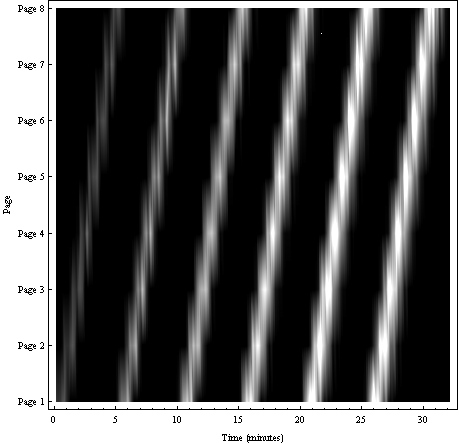
Watch that last step, it’s a doosey! By making the ramp function in steps of the same period as the testcase period, both functions are now in phase. This clearly does not spread the users out, and means that all the virtual users will all be hitting the same pages roughly within a minute of each other. This makes sense if you need to test an application where users are in a computer lab and waiting for a proctor or lecturer to tell them when to go to the next screen, but not so much for more loosely regulated applications.
Out of Phase Ramping
So, clearly, we want the ramping cycle to stay out of phase with the testcase cycle. By increasing the step period, we can put the step function out of phase with the testcase function.
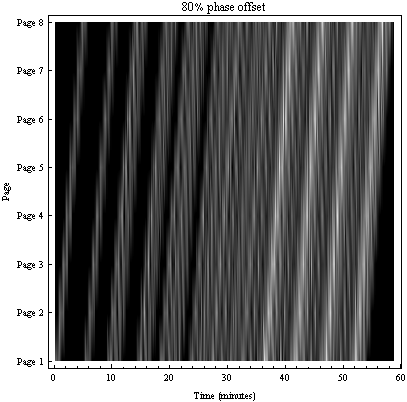

Note that in these tests, the test duration has been increased proportionally to compensate for longer step periods. As we can see, the 80% offset seems to diversify the data more quickly, but does not offer quite as much diversity as the 60% offset would ultimately offer given a longer test.
Calculating the Distribution
By now, it should be obvious that getting data to analyze user levels depends on a little more than just figuring out how long the load test will take. But, here are a few factors worth examination:
- Testcase period
- Number of user levels to analyze (steps)
- Time available to conduct the test
The last option is where we make our trade-offs. Getting the test done faster gets us results quicker. Don’t underestimate the potential for things to go awry during the test, so it’s always a good practice to leave plenty of time to scrub the test and restart if the situation requires.
When estimating the period for the step function, first a few minimums. Ideally, the period should include twice the test duration – first to allow newly added users to travel the test and avoid measuring just the testcase with new users focused early into the test, and again to measure the entire site under the increased load level. Repeated passes will provide further samples of the site at this load level, and can provide a better picture if time permits. Additionally, plan on adding at least one minute to allow new users to ramp up. This number can be increased to push the step function out of phase with the testcase function as necessary.
Having step function approach synchronization with the testcase function at least three times during the load test seems to yield good results – if the server performance does not degrade before the first third of the load test. Additionally, it helps to have at least as many steps between synchronizations of the two functions as there are minutes in the testcase function period (since each step adds users over a 1 minute window).
So here is our familiar 250 user test, ramped-up at a rate of 17 users every 12 minutes:
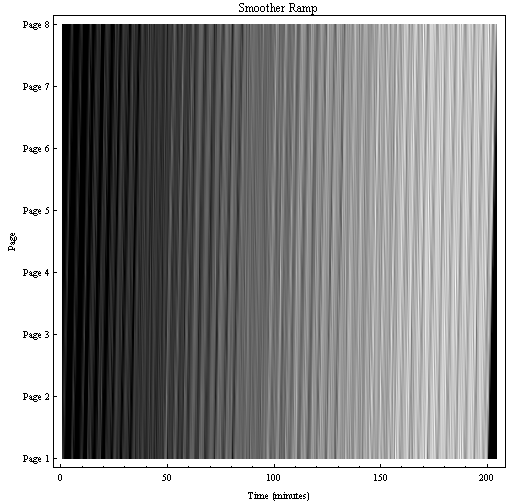
After the first third of our test, we now have users distributed evenly on most of the site. And, after each ramp, we have data that makes a quality representation of a fixed number of users almost evenly spread across the entire testcase.
The logical question is if this sort of testcase duration is necessary? Often times, it isn’t. As noted, as the server degrades in performance, the testcase periods will increase differently for different users, and the distribution can become much more erratic. This distribution seems to balance users from "clumping", where the server experiences short bursts of intense stress; versus a continuous ramp where at each user level, much of the site has been tested by a smaller portion of users than the total concurrently on the site. But, by comparing the user distribution at each user level we wish to analyze against the expected user distribution the site may have, we gain a sense of quality and confidence about the results of our test.
