Load Testing .NET Applications
Introduction
Load testing is one of those steps that should be performed for every major system rollout but rarely happens. In this article, we will demonstrate the basic procedure for load testing web-based applications, using an ASP.NET application as an example.
Why Load Test .NET?
Working for a performance tools company, I have the opportunity to assist many companies with their load testing efforts. A large number of these efforts happen immediately before deployment or shortly after deployment, when live usage has determined that performance is inadequate. Naturally, performing the load testing at this stage in the project is much more costly than it would have been earlier in the development cycle. When our customers offer us an explanation for waiting until the last minute to load test, it usually falls into a few categories “The system performed fine when 2 or 3 developers tested it, so we thought it could handle 50 with no problem”, “We like to code for correctness first and optimize later”, “Load testing is too hard”, or my favorite: “We didn’t have the budget for testing”. It goes without saying (but I’ll say it anyway) that load testing, even at a minimal level, throughout the development cycle will pay for itself by the time the project is complete.
But system performance is not the only reason to load test. One of my favorite quotes is “We didn’t load test earlier because we were not really concerned with performance as long as the system worked correctly.” Typical web applications have become so complex that single-user mode functional testing alone is no longer adequate to ensure the system works correctly. When a web application exposes complex information structures and implements complex business logic, synchronization problems resulting from simultaneous users accessing and modifying the same data can cause system defects that cannot be detected with single-user mode functional testing tools. These types of defects frequently result in incorrect behavior and/or data corruption – sometimes even complete application lockup or crashing. They are also the hardest to detect and reproduce – and are frequently blamed on other sources, such as the users, when they cannot be easily reproduced by the developers or testers.
Outline
The purpose of this tutorial is to help anyone inexperienced in load testing understand the basic steps required to successfully load test a web application. We will explore some of the issues that are encountered during any load testing effort and at least one method for addressing each of them. We will also see some specifics for load testing ASP.NET applications and how our tools, Web Performance Analyzer and Load Tester (versions 3.1), can be used to solve some of the common load testing challenges. I will attempt to demonstrate the underlying techniques needed so that the reader will be able to apply the techniques using other tools.
The basic steps we follow here will apply to nearly all load-testing efforts. We will be using the ASP.NET Issue Tracker System, part of the Microsoft ASP.NET Starter Kit, as our example application. The methodology presented applies to load testing most web applications, but we will use the example application to explore some of the testing issues that are specific to the ASP.NET architecture. Note that the process presented here is best achieved as an iterative process, rather than an all-at-once event. The steps detailed below might happen many times during the development cycle as the system development proceeds and more complex tests are attempted.
Section 1: General Load testing
- Determining the Scope
- Choosing the Test cases
- Selecting a Tool
- Preparing the Test Environment
Section 2: Load testing the Issue Tracker system
- Creating a Test case
- Establishing a Baseline
- Configure the Test case for Replay
- Executing the Test
- Analyzing the Results
- Developing More Realistic Tests
Terminology
Before jumping in, here are some terms we will be using throughout the tutorial:
test case – A specific sequence of user-initiated application actions (including navigation, data entry, queries, etc.) that corresponds to part or all of a use case.
use case – A general description of the way a user may achieve a particular goal using the application. For example, a use case might describe a user performing a search to locate a product on an e-commerce site and purchasing the product.
virtual user (VU) – A simulated person using a simulated browser to interact with a web application
Section 1: General Load testing
Determining the Scope
Start small and slowly increase complexity
When load testing happens throughout the development process, this part is easy. When starting with a mostly complete system, it can be easy to jump straight into testing the most complex test cases. This is dangerous for two reasons:
- Most applications rely on some type of application framework. Performance bottlenecks frequently occur either inside that framework, at the interface between the framework and other sub-systems (database, business logic, etc.) or in the usage patterns of the framework specific to the application under development. These problems are frequently uncovered by any use case that exercises these operations, no matter how trivial the use case is.
- Developing complex test cases can take considerably more time than simple ones. If the problem can be uncovered by a simpler test case, then application developers will have more time to work on a solution.
In either case, it is advisable to begin by load testing a few of the simplest operations in the simplest possible deployment environment. If you are new to testing or new to the application being tested, this will help develop a sense of the overall effort that will be required for more extensive testing before committing to testing deadlines that will not be achievable.
As an example: even if the system is expected to be deployed in a clustered environment, testing against a single-server implementation is valuable because it minimizes the number of variables being tested and provides a baseline against which the clustered performance can be measured at a later time. It can also be used for predicting the best possible performance of the cluster, since a clustered system looses some efficiency to the overhead of the clustering mechanism.
Define the performance goals
It is important to identify what will define success for the testing effort. Will success be defined by:
- achieving certain page-load times?
- supporting a given level of simultaneous users on the system?
- successfully completing a minimum number of transactions per minute?
- some other goal?
As you explore these questions, be highly suspicious of simple answers like “as long as the system can handle 100 simultaneous users, we’ll be happy”. Would they still be happy if the 100 simultaneous users each had 30 second response times for every page in the system? Probably not.
Try to identify the most important and most frequently used operations (they are frequently not the same) and establish goals for the acceptable performance of those operations.
Identify exceptions to the goals
Be aware that certain operations will be slower than others and that a users patience with a slow operation is related to the frequency of use and perceived value of the operation. For instance, users expect that performing a complex search might take substantial time and if it saves them a lot of effort, they might happily accept that performance. On the other hand, users will have little tolerance for slow operations that are trivial and frequently used, such as login or basic system navigation.
Choosing the Test cases
Choose verifiable use cases
One of the most important guidelines for choosing and developing the test cases is to choose use cases that are verifiable. By verifiable I mean that a successful execution of the test case leaves some evidence behind that can be verified. Preferably this verification can be done both during and after the test case. For example, consider a use case where a system administrator adds a new user to the system. The administrator would probably see a message at some point during the process such as “user Joe99 added successfully”. Testing tools can use a search string to determine if the test case was completed successfully and record an error if it did not. Additionally, the administrator could enter the system after a load test and manually verify that the expected users have been added to the system.
Start simple
It is always tempting to choose the most interesting use cases first. These are frequently the most complex and the most difficult to simulate. As a result, it is also harder to diagnose the cause of problems that are exposed during the tests — is the problem with the system or with the testing procedure? Simpler tests can be developed more quickly and when problems are exposed they can be diagnosed by the developers more easily. Since many performance problems occur in application frameworks, database configuration or other frequently-used parts of the application, they can be identified just as easily with simple tests as with more complex ones.
Choose common use cases
Although less common, a good number of performance problems are specific to a particular use case. We all want every part of our applications to perform instantly, but spending a lot of time troubleshooting a problem in a rarely used administrative operation means that time was not spent fixing problems in the more commonly used operations – the ones that user are more likely to complain about. Testing the most-frequently used use cases first will usually bring more value to your project.
Selecting a Tool
There is a wide variety of load testing tools available with an accompanying variety of price ranges. There are tools that cost 2 years of a typical developers salary. Depending on the nature of the testing requirements, they may be worth every penny. On the other side of the spectrum are free and/or open-source tools that match some testing requirements very well. Organizational differences also come into play here – as some organizations prefer to spend $5000 in man-hours to avoid spending $2000 on a tool that would get the job done in 25% of the time – for an almost immediate net savings in both time and schedule. You’ll have to make the best choices you can for your organization.
Please remember that selecting the right tool for your testing needs should not be done without actually using the tool to perform some testing – magazine reviews alone will not address the myriad of possible reasons for choosing (or not choosing) a given tool. Try out a few before committing – you might even find that a combination of tools will get the job done most effectively (both cost and time).
I’ll expend a good deal of coverage on this topic because proper tool selection will have a huge impact on your productivity – and thus your chances of a successful load testing effort. The following sections will present many questions you should be asking as you evaluate load testing tools.
For the purposes of this article, we will use Web Performance Load Tester™ version 3.1. It consists of two integrated tools, Web Performance Analyzer and Web Performance Load Tester. We will use Analyzer to record, analyze and configure the test cases. Analyzer is available in a free edition that you can use to analyze and replay test cases as demonstrated in this article. Load Tester will be used to execute the load test and analyze the results. Demo licenses of Load Tester are available from the website.
Compatibility
If a tool is not compatible with your application, then nothing else really matters, does it? And compatibility goes more than skin deep. A tool may claim, for instance, to support SSL, but it requires non-typical usage or workaround to operate properly. Or it may have a limit on the size of user state variables that it can save but your application uses the ASP.NET Viewstate mechanism that can easily grow far beyond that limit in a typical use case. Or it may allow data passed in a hidden form field to be extracted and returned with the next page request, but each instance must be configured manually – this could add many hours of configuration work for each test case – and it may need to be repeated each time the test case changes.
Some important things to consider:
- SSL
- Client Certificates
- Session Tracking (cookies, hidden form fields, user state stored in javascript variables, session IDs in URL query parameters or path segments)
- ASP.NET viewstate
- IP aliasing (important when using IP address based load balancers)
Test case Creation
How easy is it to create a test case? Some tools allow easy recording of the test case right in your browser. Others require manually creating scripts and entering each URL to be tested. Some turn the recording into a script that must be manually edited and maintained, rather than presenting the test case as a intuitive grouping of pages and URLs.
Test case Customization
What support does the tool have for customizing the test case for each simulated user? In most scenarios, a test case that performs exactly the same operation as the original recording is not very useful – in many cases it will not work at all (e.g. adding a user with the same username and password twice is usually not allowed). Typically, each simulated user would enter the system with a different identity (username/password), search with different terms or put different products into their shopping cart. Does the tool offer support for these customizations? In many systems, once a value has been entered by the user, it is carried along on several pages until the operation is completed. Will the tool change each occurrence for you, or must each occurrence be changed separately?
How does the tool validate that the response from the server is valid? Does it automatically check the status code? Can it easily check for the presence or absence of a error or success message?
Complex Tests
Any complex system will typically have many users involved in many different operations at any given time. Does the tool easily support configuration and execution of different test cases simultaneously ? Can different network speeds be simulated for different groups of simulated users?
Measurements
What does the tool measure? Is it granular enough? E.g. does it provide the detailed statistics you need to determine which URL in a test case is causing poor performance? Does it provide high-level summaries of information to help you quickly evaluate the overall system performance? Does it provide answers relevant to your testing goals, or must those answers be extrapolated from low-level statistics?
Reports
If your boss expects a nice report that clearly summarizes the findings, will you be expected to write it? Or will the tool provide it for you?
Scalability
This question comes down to load-generating efficiency. How many simulated users can the tool run on a given computer? If you only need to simulate a small number of simultaneous users, this may be less important, but if you need to simulate 1000s of users, the number of computers required by less efficient tools can quickly become cumbersome.
Preparing the Test Environment
Servers, load-generators and the network
To get accurate results, load-testing should be performed on a dedicated network that is isolated from other traffic. Likewise, the server should not be accessible by other users or be performing other tasks during the test. While it certainly can be successfully without that isolation, it can make trouble-shooting problems much harder. For instance, if you see a blip of slow response times in a graph of the page durations, in a shared environment you will never know if it was caused by a user performing a complex query or downloading a large file…or was it a real problem in the system under test? For this reason, in organizations where a dedicated load-testing environment is not available, much load-testing is done at night.
It may also be necessary to have several load-generating machines available to create the necessary network traffic during the test. The number of machines needed will be highly dependent on your testing needs and the selected tool. It is also affected by the expected network bandwidth available to your simulated users and to the use of SSL.
Your test network architecture can greatly affect your test results. In some environments, access to a system is only available via a proxy server or over a WAN link. If you must load test in this environment, be aware that any performance problems could be due bottlenecks at those network points. Be sure to include them in any investigation of poor performance.
Data population
The performance of most complex systems is related to the amount and nature of data in the supporting databases. In order to compare the results of one test to the results of another (e.g. after performing some optimizations in the system), the tests must be run on a system in the same state. Ideally, the entire system would be restored to a known state before each test. At the minimum, every attempt should be made to remove artifacts resulting from the execution of previous tests from the system. For instance, after running a test that adds new orders to an e-commerce system, run some scripts to purge those orders. Frequently, the load-testing tool can be used for this purpose.
Section 2: Load testing the Issue Tracker system
I’ve reviewed some of the general load testing issues – now we can move on to the fun part – load testing the issue tracker system.
Eventually, we would like to test users performing a mix of different functions. But it is wise to start small and work our way up to more complex tests. The remainder of this article will demonstrate how to load test a single use case – a user logging into the Issue Tracker system and entering a new issue. We will assume the Issue Tracker system has already been configured with a project and all the users have been created by the administrator and assigned to the project. Our goal is to determine if the Issue Tracker system can handle 500 users simultaneously using the system to enter new issues against the project.
Creating a Test case
A test case is a specific sequence of user-initiated application actions (including navigation, data entry, queries, etc.) that define the operation to be simulated. The test cases are created differently in each tool, but they generally fall into two categories:
- create a script by entering the URLs for each page in the use case and provide all the necessary parameters for each URL (including form fields)
- recording the test case interactively using a browser.
Most tools allow the latter – which is by far the quickest way to create a test case.
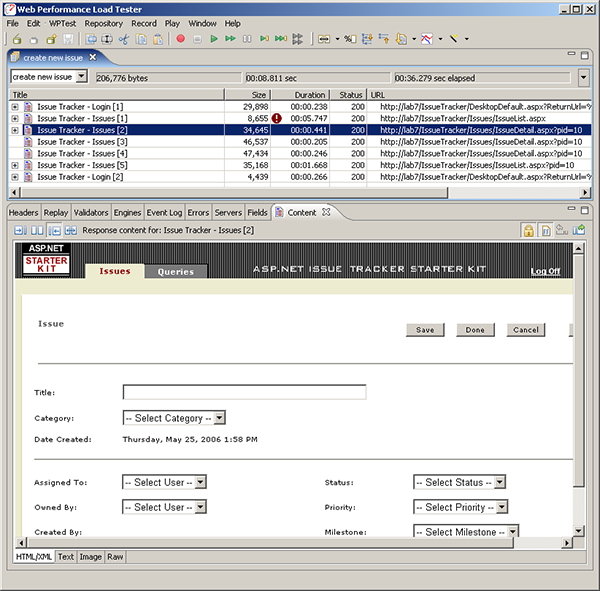
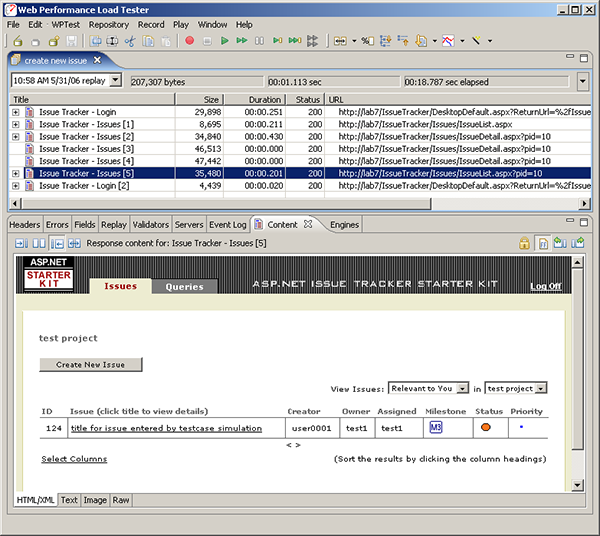
Our test case will consist of a 7 pages: login, logout and 5 pages to create the issue and enter a comment. Screen shots of a few pages are shown here to help you understand the application flow of the Issue Tracker system, in case you have never tried it. This screen shot shows the test case tree with 7 pages. The tree shows a few vital statistics about each page. Expanding the page nodes would display similar information about each page in the test case. Below the tree, one of the recorded pages is displayed – this page allows the user to enter a new issue, after pushing the Create New Issue button on the previous page.
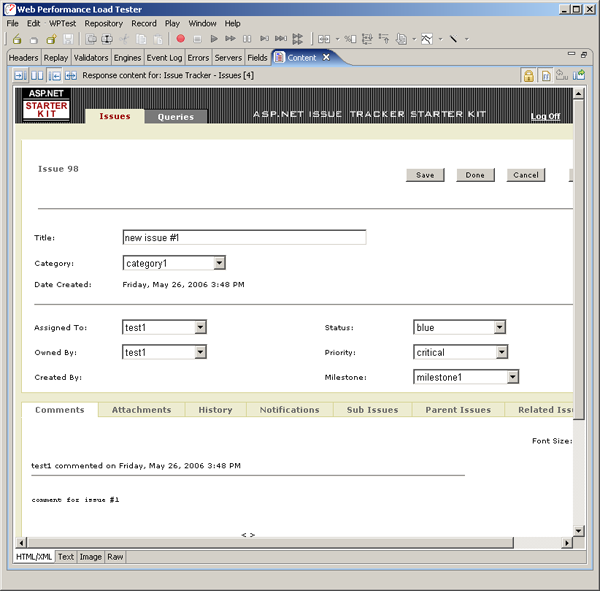
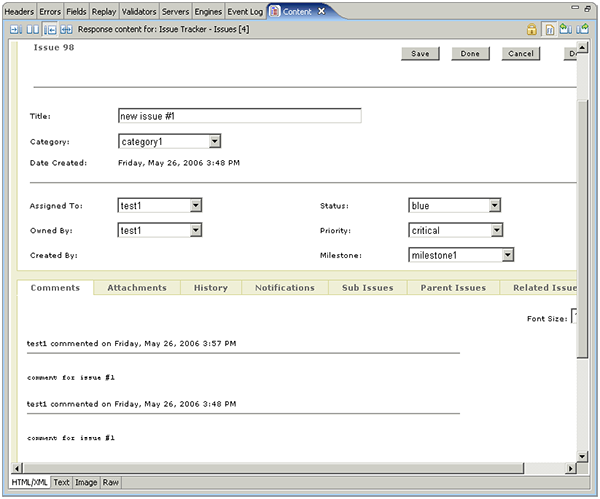
After filling out the form and pushing the save button and then adding a comment, the newly created issue looks like this:
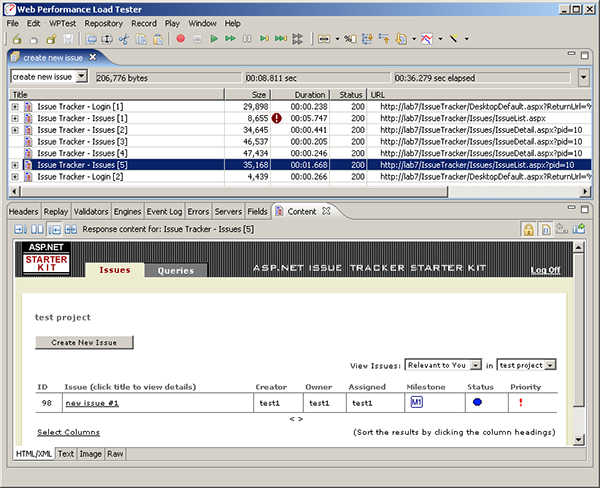
After pushing the Done button, the issues belonging to the user are displayed. This user (test1) only has one – the one we just created:
Just one more page (the logout page, not shown) finishes the test case.
Establishing a Baseline
Before jumping into a load test, it is wise to evaluate the performance of your application for a single user. We refer to this as the baseline performance of the system – it defines the standard against which the load test results should be evaluated. The performance of a system under load will never be better than the baseline performance, so if the system is not performing at the desired level with a single user, you should solve that problem before moving on to load testing.
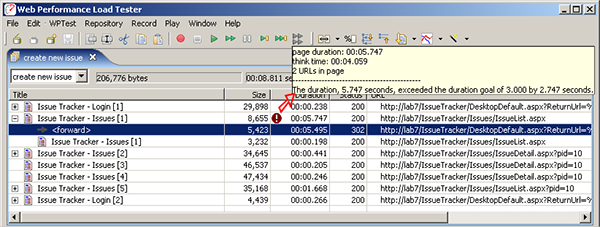
Many tools provide easy visual analysis of the performance of the pages as recorded. Some also allow easy validation of the performance by specifying the goals for the application. In our example, I configured a performance goal for page response times of <3 seconds. One page, the login page, failed to meet that goal during recording (we artificially induced this slow response time for illustrative purposes). Shown below, the tool tip indicates that the response time of 5.7 seconds exceeded the performance goal by a generous margin. Expanding the page to examine the individual transactions within the page reveals that the majority of the response time occurred in the response to the login request, not the resulting welcome page. Had this not been an artificially created problem, we would report this information to the developers so they could begin investigating the performance of the login page.
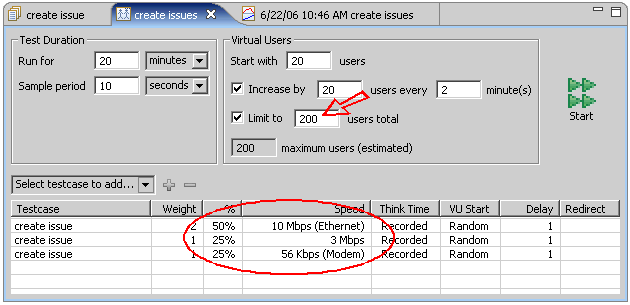
Next in our baseline performance analysis, we need to calculate the bandwidth requirements. If the bandwidth available to our server is exceeded by our expected load, then we know that this will limit the performance observed during our load test. Of the 200 expected users in our scenario, we expect half will be on the same LAN as our system – with at least 10Mb of bandwidth available to each user. We expect the remaining 100 users to be in remote offices connected with either cable modem or 56k modems, roughly 50% for each.
Most tools have a way to enter this information. In Analyzer, creating a Load Configuration allows us to create a group of users for each of the representative real users and configure the relative number of users in each group. In the screen shot below, we have configured the test for a total of 200 users and entered our different network speed profiles.
Knowing the number of users running at each bandwidth allows us to calculate the total bandwidth needed for all the users. If your selected tool doesn’t perform this calculation for you, don’t worry – the math is pretty simple. The following page from the Baseline Performance Report shows the results of those calculations – we need a minimum of nearly 20Mb of bandwidth for the expected load. This number is an absolute minimum based on the average bandwidth use of each user of the system (see the last table for per-user bandwidth consumption). If this was the limit of available bandwidth, the network would be operating at 100% capacity, which implies that users will be waiting for pages strictly due to network congestion. At this level, you can be sure that the performance of the application will likely be degraded – even if the server can easily handle the load.
How much degradation will there be? This depends greatly on the nature of your application. If your testing environment is close to this limit, then this limitation should become evident during load testing. The chart in the report also notes that the equivalent of well over 3 T1 lines would be required to provide this much bandwidth – so if all of our users were expected to be external, our network capacity planning would need to take this into account.
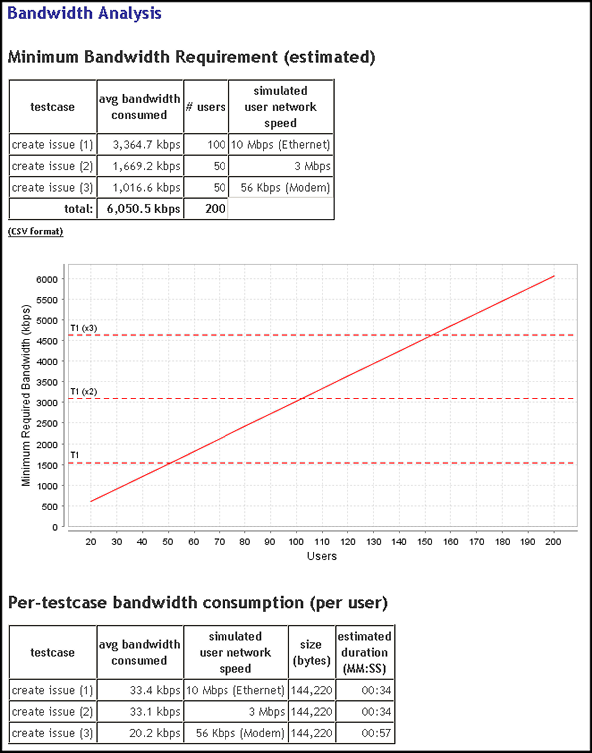
Lastly, the report shows that we can expect 56k modem to take more than 20 seconds longer (00:57) to complete the test case than LAN users (00:34). This difference indicates the increased page load times due to the slower network connection at the users end.
Once we are satisfied that the single-user performance is where it should be, we can move on.
Configure the Test case for Replay
A large portion of the hours expended in load testing occurs in this step. Configuring a test case to allow the tool to accurately simulate real users is, unfortunately, not as simple as recording the HTTP transactions and replaying them as recorded. Applications use various dynamic identifiers, parameters and hidden fields to carry the state of the user session along with each page. This generally happens in addition to the use of one or more cookies to hold session identifiers.
We will attempt this task in three steps:
- Identical Replay – at first, we will simply try to replay the test case as it was recorded. It is important to note that this use case is allowed in the application – the Issue Tracker system does not prevent a user from entering two identical issues. This is important because many use cases in real-world systems do not allow this.
- Different User – next we will change the user – so a different user will use the system to enter the same issue.
- Different Parameters – finally, we will change the data entered by the virtual user. For example, the change the title, comment, status and priority associated with the issue being entered.
Step 1 – Identical Replay
Each tool has a slightly different way to initiate a single replay of a test case; in Analyzer simply push the play button (the single green arrow). As the replay proceeds, each transaction is re-recorded and can be reviewed after the replay is complete. The first place where we can look for evidence of our replay is page 4 of the test case – after we have entered title, priority, status, etc. and pushed the Save button. If we review the results of that page (below) we can see that issue number 99 was created during the replay. If we review the original recording (see previous screen shots), we will see that the original issue was number 98. So far, so good.
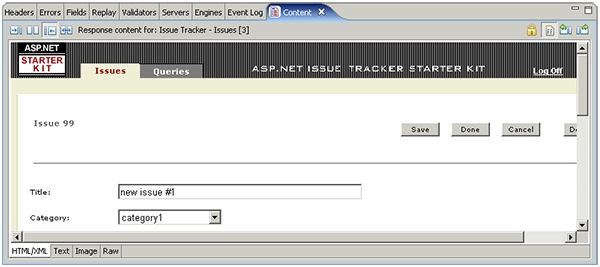
If we look to the next page, after the comment had been created, we see some less encouraging results. The issue number on the page is 98 (from the original recording) and it now has two comments. It appears that the comment was entered on the wrong issue during the replay. Logging into the system and checking verifies that the new issue (number 99) does not have a comment. So it looks like we have some work to do before we can move on.
Rather than spending a lot of time demonstrating how you might track down this problem, I’ll give you a head start: the problem is related to session tracking and application state.
Session Tracking & Application State
First, some more terminology:
Session Tracking – A mechanism used by a web application to maintain a session for a particular user. In many systems, the session begins as soon as the user access the system. In some systems, it may not begin until the user has been authenticated (or a new session might be started when the authentication is completed successfully). One or more specific techniques may be implemented to achieve session tracking. The session-tracking mechanism is usually provided by the application server or framework.
Application State – A mechanism used by a web application to maintain the state of the user within the application. While a user typically only has a single session at a time, they may have multiple application states if they use multiple browser windows.
A number of techniques are used to achieve these functions: cookies, hidden form fields, URL query parameters and URL path segments are the most common techniques. In some web-based systems, Session Tracking and Application State are the same thing…in others they are separate (the same applies to load testing tools).
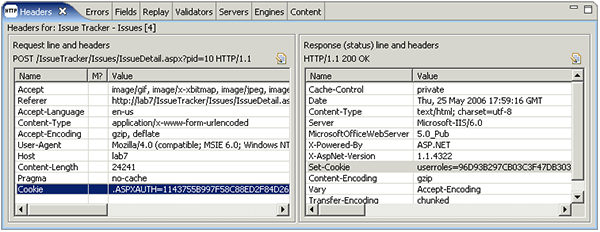
Cookies are, by far, the most common technique for both session tracking and application state. If your tool does not automatically handle cookies, you will need to extract the Set-Cookie headers returned with each response, parse them and put the values back in the Cookie headers for each request. In this screen shot, you can see the headers that are involved. Web Performance Analyzer and many other tools handle cookies automatically – so there is no work needed here.
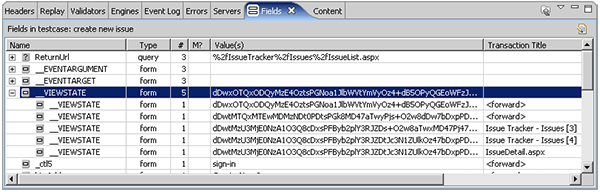
The Issue Tracker system does use cookies to track the session. However, ASP.NET applications also frequently use a mechanism called Viewstate to track the state of each application window. Some other web-application architectures use similar mechanisms to track application state. As shown here, the __VIEWSTATE field is used on 5 of the application pages and the value is different for each page:
The Viewstate is passed back to the browser as a hidden form field in each page. Examining the source of the page content reveals an example, as shown below. Note that the __VIEWSTATE field changes each time the page is requested – even if the same user repeats exactly the same test case. Also note that the __VIEWSTATE field can contain a significant amount of information – in our simple Issue Tracker example, the size of this field exceeded 25 kbytes for some pages. Each page request in the test case sends the __VIEWSTATE field back to the server – so be aware that it is a frequent source of performance problems. We have seen customers with 750 kbyte __VIEWSTATE fields! This would obviously impose severe limits on the performance over slow network connections.
Depending on the tool you select, you may need to manually configure each page with an extractor to pull the value of this field from the page and substitute it for the recorded value in the following POST transaction. Again, be sure to do this for every page that uses the viewstate, since it changes during each user session.
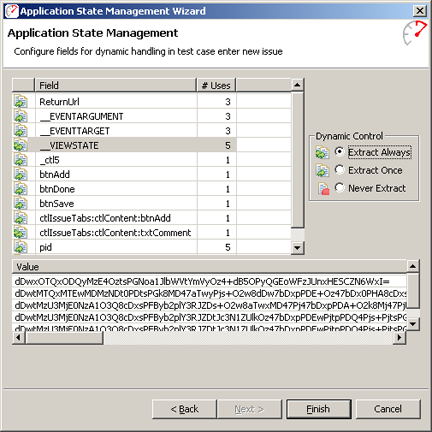
Some tools also have support for automatically detecting and configuring these variables – so keep them in mind as you evaluate tools. Analyzer calls this Application State Management (ASM). The ASM wizard will summarize the dynamic fields it locates as shown in the screen shot below. In this case, it indicates the fields that it found used to transfer application state information from one page to the next. Of particular interest is the __VIEWSTATE mentioned above. Here we can see the _VIEWSTATE field had 5 different values during the test case, corresponding roughly to the 5 application pages that we visited. You can see that the wizard suggests (correctly) that the __VIEWSTATE variable should be extracted from the page content for use on subsequent pages each time it is encountered. The wizard also allows the default behavior to be overridden – to optimize or completely ignore variables that are not necessary for the simulation of a particular test case.
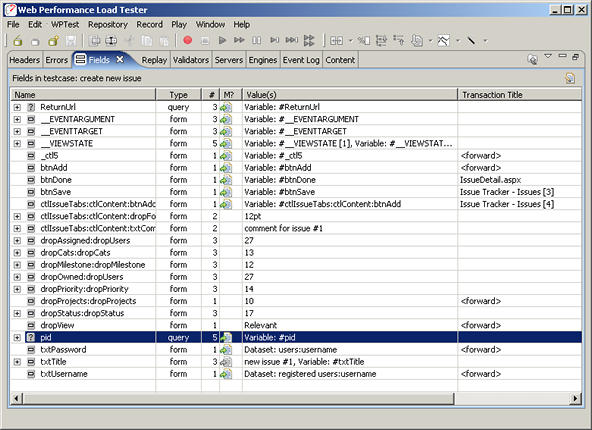
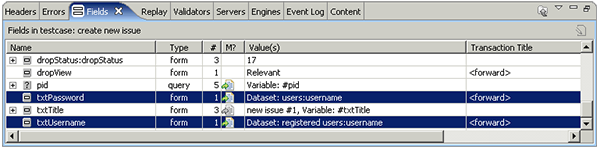
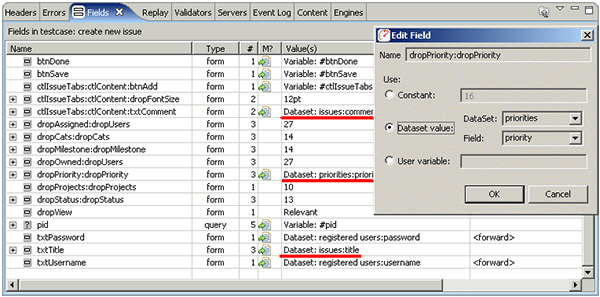
After running the wizard, the modifier column (M?) of the Fields view shows the fields that were configured with dynamic modifiers, such as __VIEWSTATE and *pid* in the screen shot below. We’ve already discussed the __VIEWSTATE field. As another example of a field containing application state information, the pid field is highlighted below – it contains the identifier of the project that the user is entering the issue against. Since different users could be members of different projects, the test case would not be simulated properly if this fields was not set correctly.
As an application tester, you may need to understand the purpose of each of these variables in order to properly configure and execute the test case. Each tool provides different levels of support for the automatic configuration of this type of application state. Analyzer does a lot of the work for you – but without a true understanding of the application, it will still be wrong a small portion of the time. If the test case simulation is not successful the first time, you will be required to work with the developers to determine how each variable should be utilized to properly simulate each page in the test case.
User Identity
In most load-testing scenarios, you will create a test case using one user identity (username/password), but will want to load test using many user identities. The load-testing tool will need a list of these identities. Some tools can get this information automatically from LDAP or Active Directory databases. For this application, there is no such interface, so we will need to provide a list of user identities and configure the test case to use the usernames and passwords provided in the list.
Use your tools fields viewer to locate the username and password fields. For example:
If your tool does not automatically locate these fields, you may need look at the raw transactions to locate the fields. Look for transactions using the POST method and then examine the post content – the fields will use application/x-www-form-urlencoded encoding, which means that the raw content will look something like this:
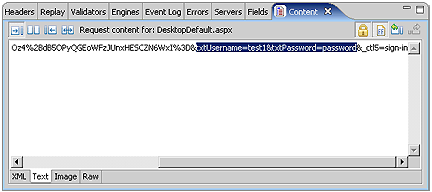
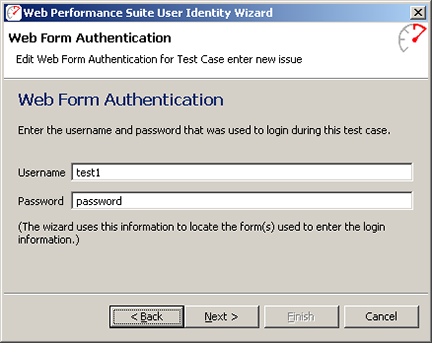
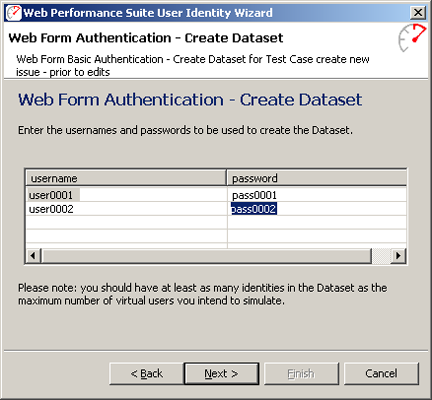
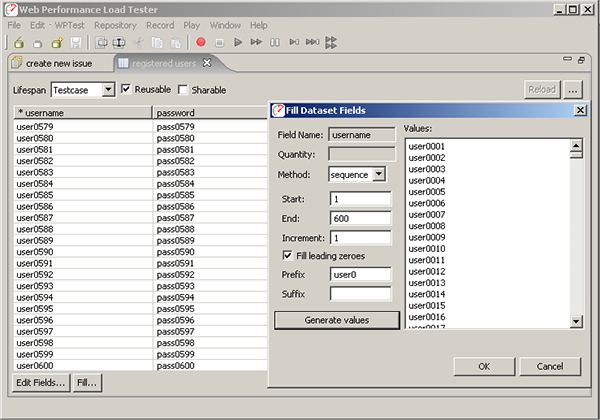
In Analyzer, the User Identity Wizard can perform most of this configuration automatically. After answering a few questions about the type of authentication used and the desired configuration, the wizard will ask for the username/password used during the recording process. It uses this information to locate the login form and configure the necessary dynamic modifiers. In this case, we used test1/password to enter the system. After asking the wizard to automatically create the dataset for us, we can enter a few user identities to get started. The system administrator created a series of users in the system so we’ll enter a few here. We will create the entire list later, after we have a successfully configured test case.
User Entered Data
Data that is entered by the user into fields in the page is generally a little easier to configure – since you, as the test case creator, know exactly what you entered – thus making it easier to identify this information in the recorded test case.
The ssue title and comment that we entered are easy to locate, as highlighted with red underlines in the screen shot below:
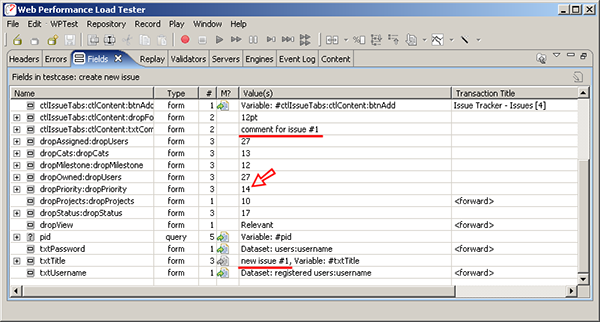
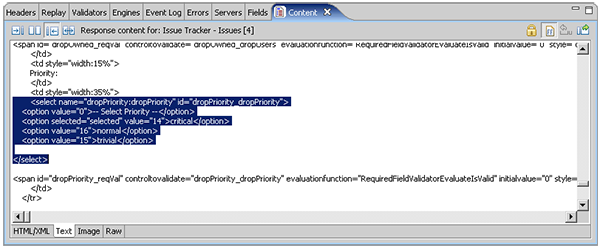
The values that we selected from drop-down lists are a little trickier. For instance, we selected critical from the priority drop-down list. But the text “critical” cannot be found in the list of fields. If we search the page source for the create new issue pages, we will find some HTML source shown in the next screen shot. You can see that the critical priority that we selected corresponds to a value of “14”. If we go back to the field list (above – red arrow), we see that the dropPriority:dropPriority field had a value of 14. If we assume that the other 5 drop-down list fields have corresponding numeric entries, we find those fields also visible in the fields list.
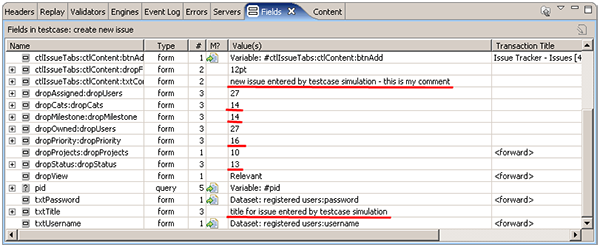
Now that we have located all of the user-entered fields, we will change each of them to a different value. The purpose here is to make minor changes to the test case so that when we attempt to replay it, we will be able to verify that it successfully completed the desired operation. Note that each of these fields occurs multiple times in the test case. Depending on the specifics of your selected tool, you may need to modify each request that submits the fields to use a new value. In our case, we can simply edit each field at the top node of the tree and all occurrences of that field will be changed at once. After checking the source for valid values for each of the drop-down fields, the modified field values can be seen in the fields list below. Note that we did not change the dropAssigned and dropOwner fields because we would like the issue to be assigned to our test user – so we can easily login and see the new issue.
We changed the fields to the following values. When we verify the results of the simulated test case, we should that these fields have the correct values.
- Category – category2 (14)
- Milestone – milestone3 (14)
- Priority – normal (16)
- Status – orange (13)
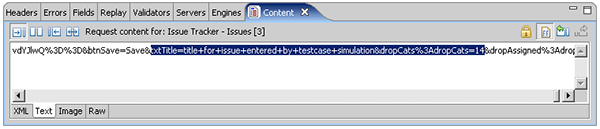
If your tool does not provide a visual representation of the fields, you will need to look into the POST transactions for the fields and make the necessary edits. In the following screen shot, the category and title fields have been highlighted in the raw content that was sent with the POST transaction for one of the pages. Note that the field names and values must be encoded correctly for the server to handle them properly – they should follow the conventions for the application/x-www-form-urlencoded scheme. If your tool doesn’t handle this automatically, you will have to ensure they are encoded correctly.
Replay the Test case
Getting this test case ready for a simulate has been somewhat arduous. I hope you still have some energy left – we’re just getting to the fun part! Now that we have customized the test case to perform the same operation, but with slightly different data, we can replay the test case and, hopefully, see a new issue successfully added.
Verify the Replay
In the screen shot below, we can see that the summary page shows the newly entered issue created during the replay. It has the title we entered when we edited the title field and the milestone, status and priority fields all match the values we provided. If your tool does not provide an easy way to review the pages visited during the replay, you can easily log into the Issue Tracker system and verify that the new issue has been added in a web browser – be sure to login using the first identity in the dataset (username=”user0001″, password=”pass0001″).
It is worth noting that the issue was created by the first user that we entered in the users dataset, since this is the identity that the simulation used for the login page. However, the issue is still owned by and assigned to the user from the original recording, test1. If we investigate the dropOwned and dropAssigned fields in the fields view, we find that these contain a “user id” that corresponds the value of each entry in the drop-down lists on the new issue entry page. This issue is easily dealt with by getting the value of this “user id” for each user and adding it to our users dataset. We will leave a description of that process to a later time. For now, we will call it done and declare victory.
Hooray! We have successfully configured the test case not only to work correctly, but we even configured it to perform a slight variation of the original function. With that behind us, we are ready to prepare for a load test.
Executing the Test
Configuring datasets
One of the primary differences between the replay we just completed and a load test is the scale. Rather than simulating a single user, we will be simulating hundreds of users (or even thousands). This means we will want to supply more data for the tool to use during the replay. For instance, we only entered 2 other user identities into our dataset, but we’ll want hundreds for running the load test. Additionally, we don’t want each issue to have the same title (or other properties) so that we will have some a means of validating that each new issue is being uniquely entered.
We will augment or create 3 datasets:
- registered users – this should be a large list of users that are already registered in the system and assigned to the project
- issues – a list of unique titles and comments to be entered for the issues
- priority – a list of the priority codes to be entered for the issues
1. Registered Users dataset
There are several options for creating a large list of users in the system for use in the load test. In some systems, the administrator has tools available to easily do this. In our case, the IssueTracker system has a method, as part of it’s web interface, for creating users and assigning them to projects. We were able to create this large list of users by providing the tool with a list of user identities and then configuring test cases for the user registration and assignment steps. We then used the tool to simulate an administrator logging in and performing the user creation / assignment steps 200 times to create our list of registered users. We won’t detail the process here – but utilizing the load-testing tool in this way greatly speeds the process and makes it easy to repeat later, if needed.
To create the dataset initially, we used the fill column utility in the dataset editor to fill each column of the users dataset with values user0000-user0200 and pass0000-pass0200 respectively, as seen in the screen shot below. Note that we have set the life span of the dataset to Test case, to indicate that the same row from the dataset should be used throughout the entire test case. The dataset has also been set to reusable to indicate that after a user identity has been used to simulate a test case, it may be used again later. It is not sharable because we do not want to simulate the same user identity attempting multiple simultaneous sessions (this may be allowed for some use cases, but it does not make sense here).
2. Issues dataset
We would like all the issues entered to be unique, so we will create a dataset of titles and comments for the virtual users to use when filling out the new issue form. The screen shot below shows the dataset we created using the technique described above. Note that the dataset is marked as non-reusable. We have generated 50,000 issues in our dataset and we do not want duplicate issues entered in the system. Marking them as non-reusable will ensure that each row is only used once. Because of this, we must think ahead about the size of our test because when the last row from this dataset is used, the test will be automatically halted by the tool since the virtual users would not be able to successfully execute the test case.
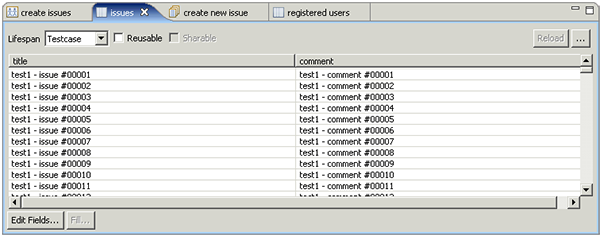
Note that we have named each issue (and comment) starting with “test1”. In most load-testing efforts, you can anticipate running tests several times before arriving at acceptable results. Using test-specific text in the test cases frequently makes it easier to verify which data came from which test – and remove that data when needed.
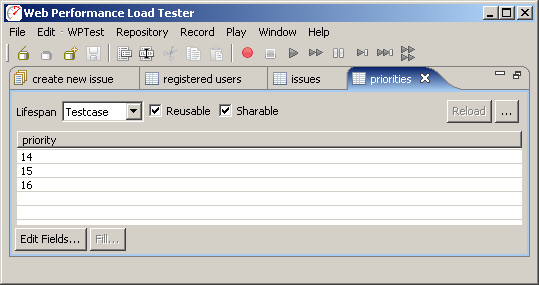
3. Priority dataset
We would like the virtual users to use all three of the available priority fields. As we saw above, these correspond to the dropPriority:dropPriority field as shown in the fields view. We also saw that this project had 3 available priorities: critical (14), normal (15), and trivial(16). We will enter the three desired values for the field into a dataset (as seen below). Note that in this case, we have marked the dataset as both reusable and sharable. If it was not reusable, the virtual users would quickly run out of data. If it was not sharable, then only 3 virtual users could be simulated at a time. We have left the life span of the dataset as “Test case” because the field is passed along on several forms – the “Test case” life span will ensure the same value is used on each form within the test case.
Once the dataset’s have been created, we can manually configure each field to use values from the dataset. In the Web Performance products, we refer to this as configuring a field modifier. Double-clicking the modifier column (“M?”) invokes the dialog shown below, which is used to configure each of the highlighted fields to use the dataset’s as defined above.
In a full-scale load testing effort, we would also configure dataset’s and modifiers for the dropStatus:dropStatus and dropMilestone:dropMilestone fields – we’ll skip those steps for the purposes of this tutorial. That completes the creation and configuration needed for the datasets and related fields.
Validation
It is wise to perform some validation after critical steps in the test case. Some of the most frequent errors in load testing configuration occur at the login step. Common errors include improper test case. configuration (which we’ve already successfully completed) and supplying a list of logins that is not entirely correct. The resulting errors are occasionally misinterpreted as performance problems, wasting time and effort in the troubleshooting process. So we would like to perform a validation of the login step to ensure the user has been successfully authenticated before proceeding with the rest of the test case. If an invalided login is attempted in the Issue Tracker system, the following message is displayed:
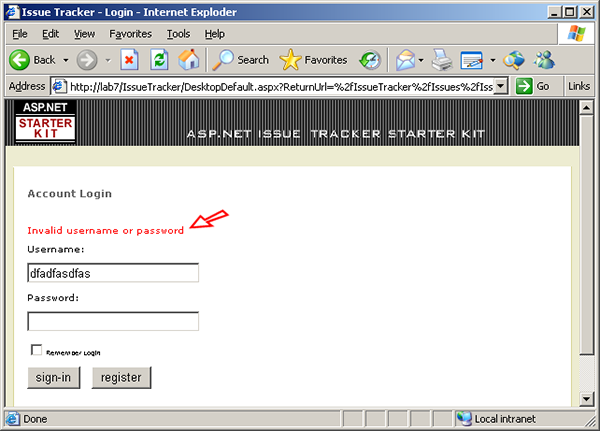
The test case. can easily be configured to check for this message and flag an error when it happens. This error will prevent the VU from attempting the remainder of the test case. – which is desirable since the test case. cannot be completed correctly if the login fails. Most tools have some method of easily checking for some content in a page returned from the server. In our tool, simply select the page in the test case, open the Validators view and configure the desired validation method, as show below:
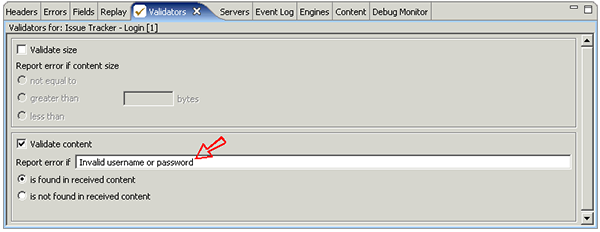
Now we’ll see a validation error if some of the logins in our dataset are not valid…or if the server becomes overloaded and does not users to login.
Note that Analyzer will automatically detect application errors if the application returns an appropriate status code. For instance, internal application errors that generate a 500 status response would automatically be counted as an error. However, far too many web applications return a 200 (OK) response even when an error has occurred. The failed login shown above is one example.
Server Monitoring
During the test, we would like to monitor the CPU usage of our server to aid in the analysis of the test results. Different tools have widely varying capabilities in this regard. The Web Performance tool can monitor in a number of different ways. In this case, since our server is running on Windows, we can directly access the Windows Performance Counters to measure CPU and memory utilization. Using this method, assuming we have already established authentication with the server, we can simply push the Add… button in the Servers view and enter the machine name, as shown below:
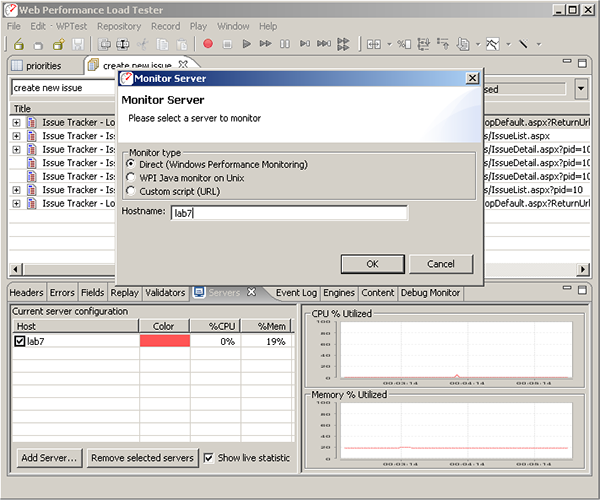
This will track the server CPU and memory utilization during the test. Note that the Windows Performance Counter APIs relies on authentication already having been established between the two machines. This is most easily achieved by browsing a network share on the server or performing some other form or remote authentication from the local computer. The Windows Performance Counter APIs unfortunately cache this information per-process, so once the “Monitor Server” operation has been attempted and failed, the program must be restarted before the new credentials will be recognized. The Web Performance products can also directly monitor any Java-based application by deploying our monitoring web-app (.war). See the user manual for more information.
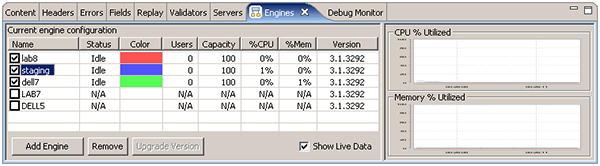
Engine Configuration
In order to perform large tests, it may be necessary to use more than one computer to generate the required load. Many tools have this capability – in our case, we simply install the software on another computer, start up the Load Engine on each computer, open the Engines view and select the engines to be used for the test. In this case, we will be using 3 remote engines, as shown here:
Configure the test
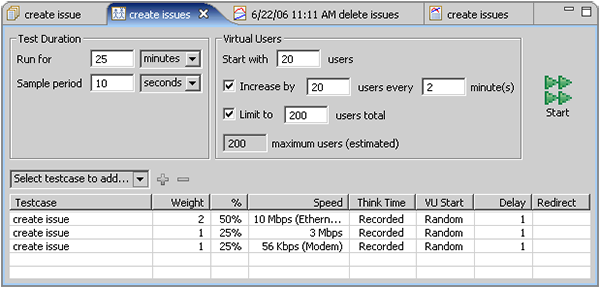
Since we have never load-tested this application before, we have no idea how it will respond. Maybe it will run fine with 200 users. Maybe it will crash after 150. So the purpose of this first test is to roughly estimate the capacity of the system. After that has been determined, we could configure tests to give us more precise data
We will start with 20 users and add 20 users every 2 minutes until our 200 configured users are all running. This will give us 1 minutes of running at steady-state conditions (the same number of simulated users). at each user level (20, 40, 60…200). Since the test case. takes approximately 20 seconds to complete (under no-load conditions), this will be plenty of time for the tool to gather data at each load level. If we had longer test cases, we would want to stay at each user level longer to ensure enough data is gathered from which to draw conclusions about the application performance.
At the above rate, it will take approximately 20 minutes to reach the desired maximum load level. Just to be safe, we will configure the test to run for 25 minutes – we can stop it early if needed. During that time, if the maximum 200 users were all executing the 20 second test case. 3 times per minute, we would add 12,000 issues to the system. The 50,000 issues in our dataset will be more than sufficient to complete the test.
Run the test
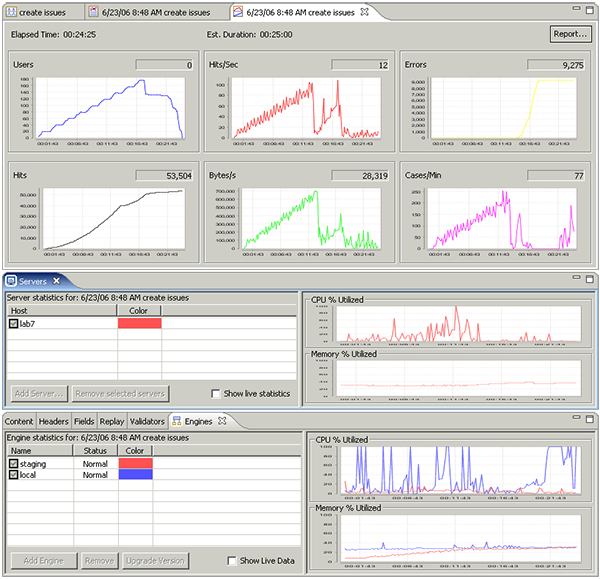
Finally, we are ready to run the test! At this point, it is pretty easy – push the Start button and wait for the end. During the test, we can observe some key parameters such as the number of simulated users, hits/sec and errors. We can also monitor the CPU and memory utilization of the server and the two load-generating engines.
Analyzing the Results
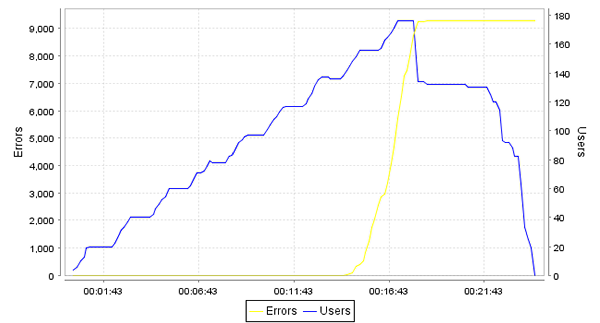
When analyzing load test results, a review of the high-level statistics will give a quick indication of any system limitations that were encountered. Load Tester provides a comprehensive report with a myriad of charts and tables of data for analyzing the test results – other tools provide some similar analysis functions. The following screen shot shows the report viewer within Load Tester. The buttons at the top indicate the available report sections. The Summary section (shown) starts with some high-level statistics and a chart of the Hits/Sec recorded during the test:
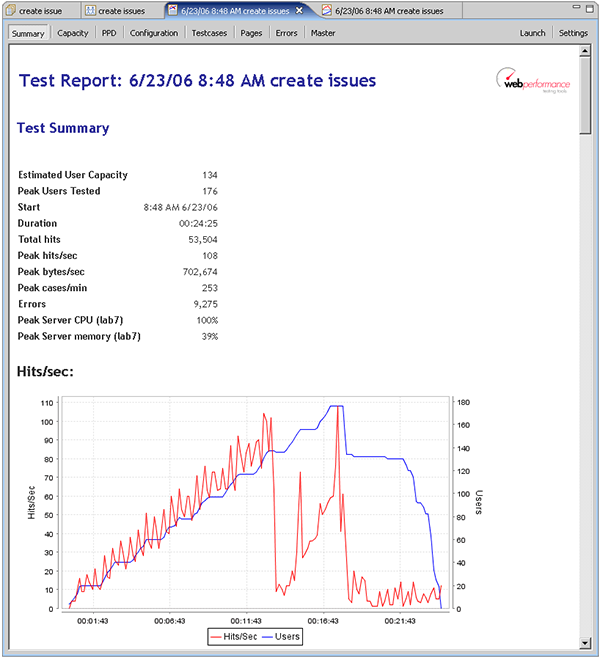
The hits/sec chart indicates that the number of requests being serviced dropped off at approximately 13 minutes in the test – when the test was running 130-140 virtual users. If we scroll down to the Errors chart, we see that shortly after the hits/sec dropped off, the tool started reporting a large number of errors.
Errors
Before we jump to any conclusions, we should investigate a little further. Why did the hits/second drop off? If we switch to the Pages section of the report, we see the answer to the question:
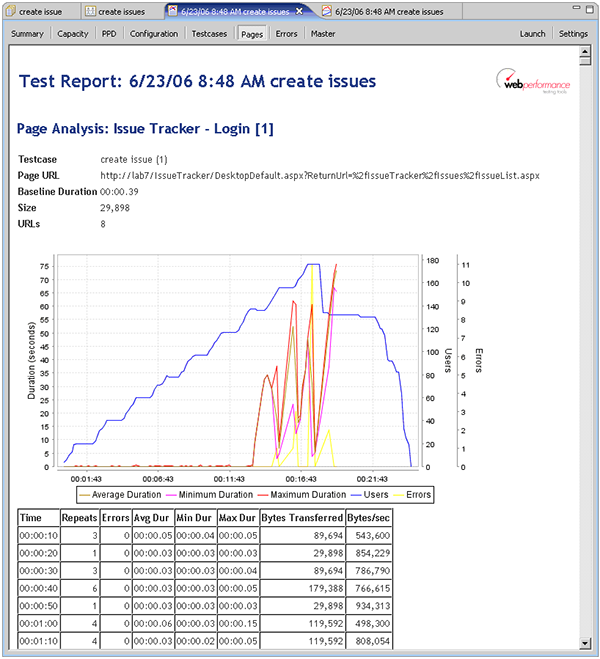
Shortly after the hits/sec dropped off, we see that the durations for the first page (the login page) had increased dramatically. The durations had been consistently in the sub-second range and suddenly jumped into the 5-60 second range. Even the minimum durations were significantly above the acceptable range. If we scroll down through the Pages section, we see similar results for every page in the test. This indicates that the server had essentially stopped responding. It seems evident that we have pushed the server to the limit and beyond. So can we now answer the question “How many users can the site handle?”. If we switch to the User Capacity report section, we can see that our estimated user capacity is 134 users.
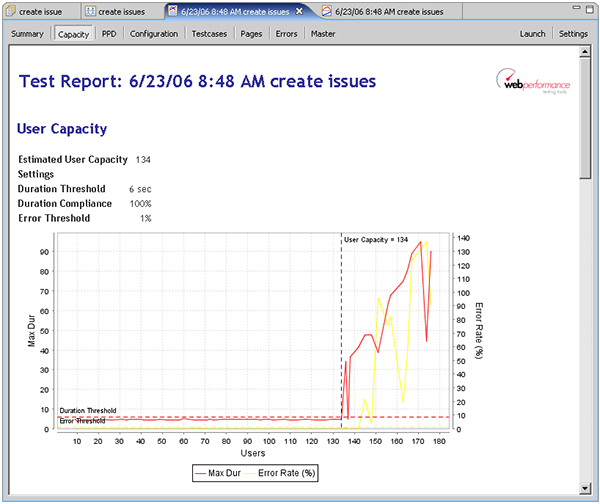
Note that we have specified a 6 second duration threshold with 100% compliance. This means that every page must load within 6 seconds to meet our performance goals. We have also configured the report to allow a maximum of 1% of the transactions to return errors. If we wanted to tighten our performance requirements a bit, such as 5 second page load times and 0% errors, we see that the estimated capacity drops to 58:
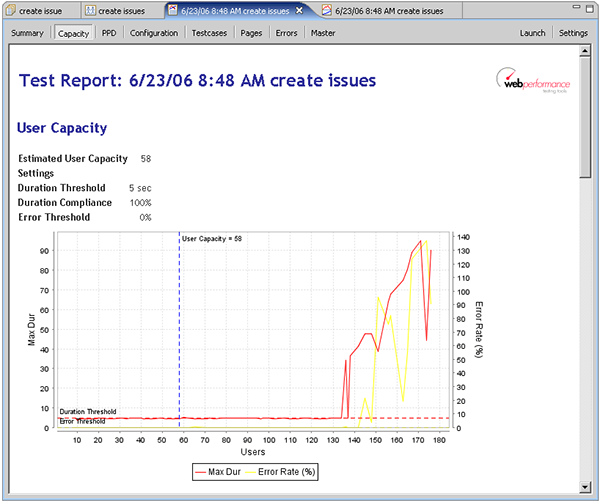
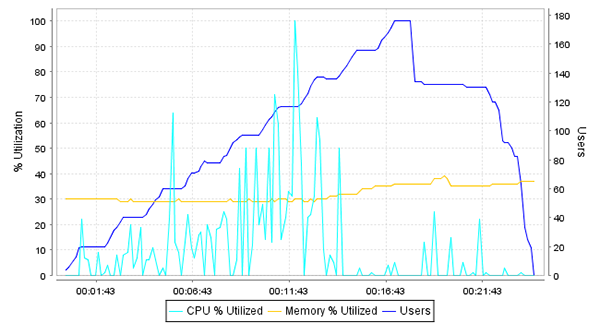
With the information gathered during the load test, we could now start diagnosing the problems with the system if additional capacity is required. We could also repeat the test while running diagnostic monitoring tools on the server to help determine where the bottlenecks are. This diagnosis is beyond the scope of this article, but it should be clear that without load testing, the limitation of the system would not have been apparent until the system reached the limits in live use. The non-linearity of the system response to increasing load would have been exceptionally difficult to predict based on an analysis of the hardware capacity or software architecture. Indeed, looking at the server CPU chart (below) indicates that the server was not under significant CPU or memory load when the application performance started to degrade. In fact, the server was almost completely idle while all pages in the system were responding very slowly. This kind of non-linear response frequently indicates a deadlock or database locking problem, but could be caused by any number of other problems.
Server statistics
Developing More Complex Tests
The test we have demonstrated was relatively simple. It has a single test case. – a user adding a new issue to the system. The test case. was run at three different networks speeds to reflect the expected mix of user connectivity options.
Multiple test case. load configurations
The next most common test configuration would be to test a combination of user activities, such as:
- new users registering
- existing users entering new issues
- users commenting on issues created by other users
- user editing the status, priority or assignment of issues
This process is not significantly different that what we have already presented. The majority of the effort will be in recording and customizing a test case. for each of the scenarios in the test.
A number of other complexities may be introduced to the test process to further increase the accuracy of the simulation:
- SSL and Client Certificates
- IP Aliasing – simulate traffic originating from many IP addresses (required with certain load-balancing architectures)
Conclusion
Our test results for the Issue Tracker ASP.NET application indicate that non-linear performance under load is a serious problem even with very simple systems. Since most systems are considerably more complex than the Issue Tracker, it is easy to see how difficult it would be to predict application performance under load.
Load testing ASP.NET applications is easy enough to justify inclusion in any project for business-critical systems. If system downtime has measurable cost, then it is easy to determine if the risk of performance problems outweighs the cost of load testing.
Christopher L Merrill
©2006 Web Performance, Inc; June 23rd, 2006; v1.2
Version History
v1.0 – 1st public release (23 June 2006)
v1.1 – email cleanup (23 Jan 09)
When his dad brought home a Commodore PET computer, Chris was drawn into computers. 7 years later, after finishing his degree in Computer and Electrical Engineering at Purdue University, he found himself writing software for industrial control systems. His first foray into testing software resulted in an innovative control system for testing lubricants in automotive engines. The Internet grabbed his attention and he became one of the first Sun Certified Java Developers. His focus then locked on performance testing of websites. As Chief Engineer for Web Performance since 2001, Chris now spends his time turning real-world testing challenges into new features for the Load Tester product.
Get web performance news
Occasional load-testing tips, performance-engineering notes, and product updates. No spam — unsubscribe anytime.
2 Comments
10 April 2014 fxjeep
a simple question:
Lastly, the report shows that we can expect 56k modem to take more than 30 seconds longer (1:22) to complete the test case than LAN users (00:49). This difference indicates the increased page load times due to the slower network connection at the users end.
Where did you get those two figures: 1:22 and 00:49
I can not see it in report image.
Thanks alot.
11 April 2014 Chris
You are correct – the numbers are incorrect based on the report. I’ve updated the text to reflect the numbers in the report (00:57 and 00:34). Thanks!