Impact of Zend Platform on PHP Performance
Load Testing SugarCRM and the Zend Platform
Christopher L Merrill
©2007 Web Performance, Inc.
v1.1
Summary
The performance of our reference PHP application under load (a default SugarCRM installation) showed a 140% increase, measured by total system capacity, after installation of the Zend Platform. As this represents 2.4 times the baseline capacity, this finding confirms Zend's claim of "2x-3x increase in performance for most applications" when using the Zend Platform.Overview
This article measures the performance impact of the Zend Platform on a real-world processor-bound PHP application (SugarCRM) under load. Our measure of performance is user capacity. We define that as the number of simultaneous users that the system can support while meeting the specified performance criteria. The performance critera for this test require that all pages load within 6 seconds and no errors are encountered in the application.The Zend Platform Feature Page lists numerous features including a Code Acclerator, which is described as: "Code Acceleration increases user responsiveness and application performance using a combination of automated caching and optimization techniques." Zend makes the following performance claim: "2x-3x increase in performance for most applications".
We test this assertion using SugarCRM as our reference application. According to the SugarCRM website, SugarCRM is "the market-leading comercial open source CRM application". SugarCRM is written in PHP. Based on previous testing, SugarCRM becomes quickly processor-bound on a typical installation. Measurement showed that the majority of the CPU load (~75%) was consumed in the Apache httpd processes, which makes it a perfect choice for testing the impact of a PHP optimizer.
The tests were performed using the default Zend Platform settings.
Caveats
This report is concerned with the performance of the system under load. It does not make any statements about the performance of an idle system. The measurements may be quite different when a single user accesses the system.The purpose of the report is not to estimate the capacity of a SugarCRM system or make any predictions about expected performance. Every SugarCRM deployment will be different. The purpose is to measure the performance before and after installing the Zend Platform to determine performance benefits of the platform on a real-world processor-bound PHP application.
Methodology
The analysis is based on the results of a series of load tests performed in our test lab.To skip the methodology, you can jump straight to the analysis.
Software
The Zend Platform version 3.5.0 was installed using the procedure in the Installation Guide (ZendPlatform-3.5.0-linux-glibc23-i386.tar.gz). The settings for the Zend Platform were not changed after the platform was installed.Both tests were run using PHP 5.1.6.
The server is running version 4.5.1e of SugarCRM installed via the standard installer (SugarOS-4.5.1e.zip).
The output from phpinfo() was captured for the baseline and optimized test configurations.
The load-testing software is Web Performance Load Tester 3.5.5447. The Web Performance Server Agent (same version) was installed on the server.
Hardware and OS
The SugarCRM server is running on a Dell Poweredge SC1420 with 2 x 2.8 GHz Xeon processors and 2GB of RAM. It has an 800MHz bus and 1MB of L2 Cache. All factory BIOS settings were restored prior to testing. This includes the hyperthreading support which is enabled. The floppy drive support in the BIOS disabled (no floppy drive is installed). The server contains a single Western Digital 80G (WD800JD) SATA disk drive and uses the on-board 1G network adapter. The operating system is the standard server install of CentOS 5.The load-generating engines (3) are each running on a Dell Poweredge 300 with 2 x 800MHz Pentium III processors with 1G of RAM. Each engine is running the Web Performance Load Engine 3.5 Boot Disk version 3.5.5275. For these tests, one load engine would have been sufficient.
The engines and server are networked via a Dell 2324 Powerconnect switch. The server is connected to a 1Gb port and the load engines are each connected to 100Mb ports.
The load test controller (the Load Tester GUI) is running on Windows XP SP2 on an IBM Thinkpad Z61m. It is connected via a second switch on a 100Mb port. This has no impact on the results, since the controller bandwidth requirements are small, but is mentioned here for completeness.
Testcases
The testcases selected for this load test mirror those selected for the SugarCRM Load Testing tutorial.Please note that the user mix, think times etc. may or may not reflect your SugarCRM implementation. The rated user capacity of the system is not likely to reflect any specific real-world deployment. To a large extent, these choices are irrelevant to this test, since the goal is not to evaluate the performance of SugarCRM, but rather determine the impact of the platform on before-and-after results.
The test data respository file is available for examination - the demo version of Load Tester can view the testcases, load configurations and detailed raw metrics. It cannot view the test reports, which is why they are linked from this page (see references).
Load Configuration
The Load Configuration was created with these parameters:- Four testcases, as described above
- VUs (virtual users) are distributed among the testcases as descibed in the SugarCRM Load Testing tutorial.
- VUs use the recorded think times, which are typically ~2-6 seconds per page. Think times are larger for some pages pages, such as adding a contact or a note, or reading a note.
- Each VU is simulating a 5Mbps network connection (e.g. cable/DSL connection)
- The test starts with 20 users and adds 1 user every minute. VUs start at random intervals within each minute.
- 10 second sample period
Database Management
The database was restored to an identical state prior to each test using the procedures outlined in the SugarCRM Load Testing tutorial.Test Procedure
Each test run followed these steps:- Restore database to pre-configured state with 100 users and 250 accounts, 1000 contacts and 3000 notes.
- Restart the server
- Start the server monitoring agent
- Run warm-up test (5 users running the View Note testcase for 3 minutes)
- Run the load test
Analysis
User Capacity
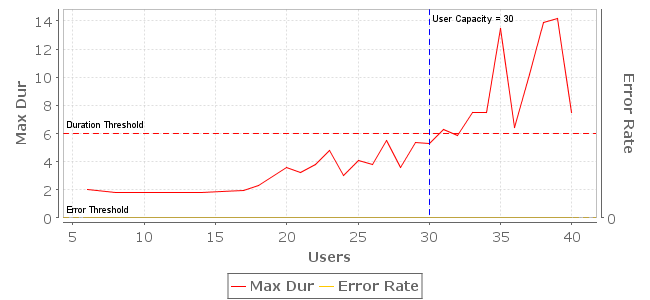
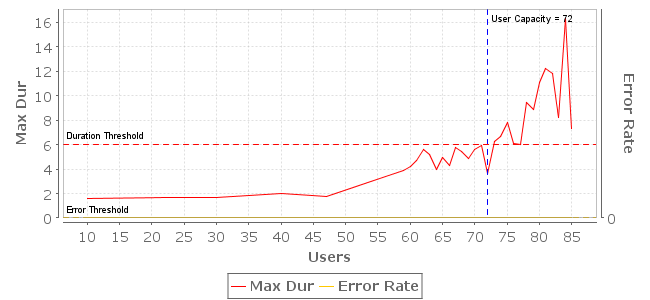
Our analysis shows the capacity of the baseline system was 30 users. After installing the Zend Platform, the capacity increased to 72 - an increase of 140% over the baseline capacity. This analysis, along with a variety of charts is produced automatically in Load Tester's Load Test Report. Consult the User Capacity section of the test reports for more details on this analysis (see references). The charts shown below are extracted from that report section. The red line on the chart depicts the maximum page duration at each user level measured during the test. The location where that line crosses the duration threshold indicates the point where performance no longer met the criteria. Had any errors occurred during the test, the yellow line would depict the error rate and indicate when it crossed the error threshold. Note that the baseline test encountered some page durations that were higher than the APC test, resulting in a different scale on the two charts.Baseline User Capacity analysis
Zend Platform User Capacity analysis
Page Duration
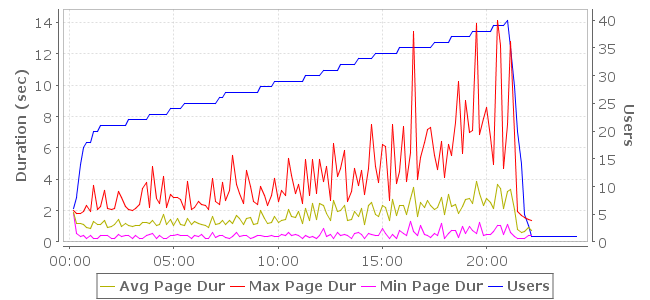
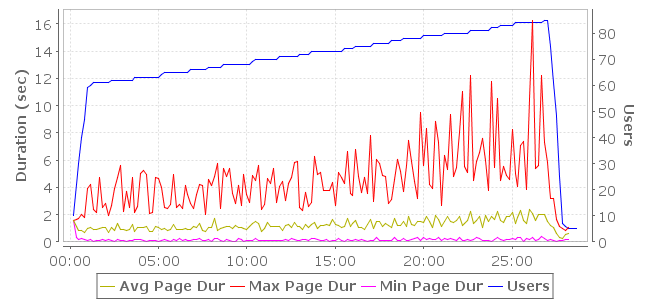
To confirm the findings from the User Capacity analysis, we next look to the Page Duration charts. These show the minimum, maximum and average page durations during the test. These charts are from the Summary section of the load test reports. Note that the Zend Platform was running more than double the number of users during most of the test, resulting in a different scales on the two charts.When the baseline (unoptimized) system had reached its maximum capacity, the average page durations had roughly doubled (from 1 second to 2). When the maximum capacity was reached running the Zend Platform, the average page durations had not degraded substantially.
Baseline page durations
Zend Platform page durations
Server processor utilization
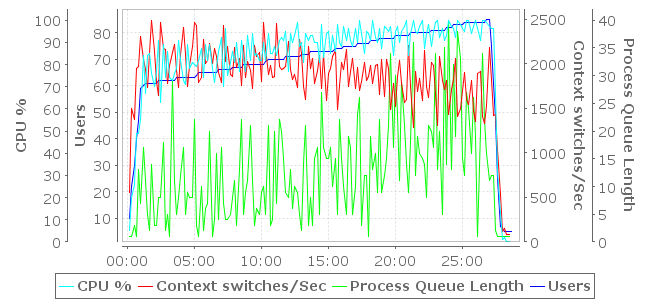
As expected, the limiting factor in the application performance is processor utilization. The charts below (extracted from the Servers section of the load test reports) show several processor-related measurements that were collected during the test using the Advanced Server Analysis module. The light-blue plot depicts the CPU utilization (%). In both tests, the CPU is nearing 100% utilization when the page duration thresholds fail. Note that the Zend Platform was running more than double the number of users during most of the test, resulting in a different scale Users axis on the two charts.Baseline processor measurements
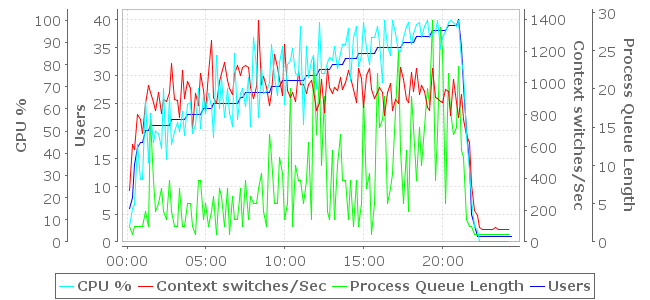
Zend Platform processor measurements
Conclusion
Under the conditions tested, the reference PHP application (SugarCRM) showed a 140% increase in total user capacity when the Zend Platform was used. In other words, the Zend Platform system had 2.4 times the capacity of the baseline (unoptimized) system.Reference Materials
- phpinfo() output for baseline test
- complete load test report for baseline test
- phpinfo() output for Zend Platform
- complete load test report for the Zend Platform test
- Load Tester repository file (to be used with Web Performance Load Tester for further data analysis)
Feedback & Comments
Comments about this report may be posted at the company blog post.
Version History
v1.0 - 1st public release (4 Mar 2008)
v1.1 - email cleanup (23 Jan 09)
Get web performance news
Occasional load-testing tips, performance-engineering notes, and product updates. No spam — unsubscribe anytime.