Servlet Performance Report:
Comparing The Performance of J2EE Servers
Christopher L Merrill
©2004 Web Performance, Inc; July 7, 2004; v2.3
This article is translated to Serbo-Croatian language by Jovana Milutinovich from WebHostingGeeks.com.
Contents
- Introduction
- The Servers
- Testing goals
- The Tests
- Methodology
- Change Log
- Results
- Analysis
- Future Directions
- Addendum 1: Resin
- Addendum 2: Jetty
- Feedback & Comments
- Version History
- Supplemental Materials (downloads)
Introduction
If you have read the previous version of our report, you may want to skip directly to the Changes section for a summary of how our testing methodology has changed for this version.
The standardization of the application server, thanks to Sun's J2EE specifications, has spawned a wealth of implementations. There are offerings from big players such as Sun, IBM, BEA and Oracle as well as numerous offerings from low-cost vendors and the open-source community.
Like most developers, I participate in a number of technical forums and mailing lists. A recurring topic on servlet-development forums is “Which J2EE server should I use for my servlet-based application?” There are a number of criteria for selecting a server: ease of installation, quality of documentation, reliability, cost and performance. Some of these aspects are readily apparent to the evaluator; but performance seems to generate a lot of discussion with a notable lack of facts. After a quick search, I was surprised that few usable benchmarks have been published comparing the servlet performance of the popular low-cost servers.
SPECjAppServer2002
Shortly after the publication of the v1.0 of this report, the Standard Performance Evaluation Corporation published SPECjAppServer2002, a "client/server benchmark for measuring the performance of Java Enterprise Application Servers using a subset of J2EE APIs in a complete end-to-end web application." Details and results of this benchmark are available at http://www.spec.org/jAppServer2002/. In my opinion, this benchmark specification has little value for small projects, since it does not test all servers on the same hardware – which skews the results towards the vendors that choose to fund extravagant hardware configurations. On the other hand, the benchmark is intended to focus on total cost - transactions per dollar of investment. For large implementations, this can be very valuable information. It would be interesting to test this benchmark in a setting similar to this report: all servers running in default configurations on the same hardware. Unfortunately, the cost of SPECjAppServer2002 licensing cost is beyond our budget.
Motivation
My personal curiosity was the driving factor that initiated this effort. The development and testing for this report is funded solely by our company as an effort to contribute back to the Java community from which we have gained so much.
disclaimer and disclosure:
- All statements and opinions made in this document are solely those of the author. They do not represent the views and/or policies of Web Performance, Inc.
- Web Performance, Inc. uses Tomcat for running internal Wiki and some testing suites.
The Servers
- Apache Tomcat 5.0.25
- IronFlare Orion 2.0.2
- MortBay Jetty 4.2.20
- Caucho Resin 3.0.8
- IBM WebSphere 5.1
- Macromedia JRun 4 (update 3)
Several servers were originally targeted for this report, but results have been withheld because their licenses prohibit the publication of performance benchmarks without permission. Permission was requested from these vendors, but the permission has not yet been granted. We hope to include them in the report soon after we receive permission to publish. These servers include:
- Sun Java System Application Server
- BEA WebLogic Application Server
- Pramati Server
A special thanks
I would like to extend a special thanks to those companies that do not put unreasonable restrictions on publication of performance benchmarks (Caucho, IronFlare and IBM). An open, informed marketplace is beneficial to us all...including the competitors. IBM deserves special mention for their very clear and very fair benchmarking clause. To paraphrase, the license agreement states that performance benchmarks may be published if it is accompanied by full disclosure of testing methodology. In addition, it has an "if you benchmark our product, you agree that we can benchmark your product". I am not a lawyer, but in my opinion this is a very fair way to deal with competitors who might try to take advantage of a more flexible license agreement.
Testing goals
The purpose is not to declare a 'winner' - that is best left to publications seeking advertising revenue. Instead, this report provides a number of different measurements of server performance under load. The data is presented along with some analysis and commentary. Choosing a winner is left to the reader.
Usage Scenario
This report is intended to evaluate the servlet performance of a stand-alone server. This is expected to be applicable to small-to-medium projects that are deploying applications in departmental or small corporate environments. It is not intended to represent the performance of the server in a clustered or distributed environment. Nor is it expected to reflect the performance of a server that has been highly optimized to achieve maximum performance for a particular application.
Difficulties of Benchmarking
An old saying goes: "There are lies, damned lies and benchmarks!". Well aware of the danger of flawed benchmarks, there is no expectation that this report will reflect the performance of any particular application, or class of applications, that might be deployed in the real world. Any given application will stress different parts of a server. Some applications will run better on some servers than others. Hopefully, this report provides data that helps the reader weigh the performance trade-offs of various servers.
Raw Numbers vs. Relative Performance
Due to the variability of application and hardware configurations, this report can not tell you how many users your application will be able to handle in your environment (which is why we sell a product for exactly that purpose!). This report will produce numbers such as hits/sec and average page duration, but the raw numbers have little value by themselves. Only when the statistics are compared against the other servers do they provide valuable insight on which to make performance judgments.
It may seem obvious to some, but it is important to reinforce this point: If the data for this test indicates that Server X can serve 200 hits/sec with an average duration under 2 seconds, there is no correlation to the number of hits/sec that your application will be capable of. The data presented here for Server X is ONLY useful for comparison against the data for Server Y and Server Z, under the identical test conditions of our test lab. Additionally, please note the hardware used for the server during these tests (see Hardware Configuration, below) is by no means a state-of-the-art configuration.
Out-of-the-box Performance
It is useful to know how these servers will perform immediately after installation. A large number of projects do not have the expertise or the resources to perform extensive performance tuning. The tests are performed on each server in their default configuration after installation. (see the Methodology section).
Reproducible Results
No matter how this testing is performed, someone will scream "Foul Play!" A primary goal of this effort is a test that is easily duplicated by anyone else who wants to try. No doubt the exact numbers will not be duplicated, due to differences in hardware and measurement technique, but the relative differences between the servers should be reproducible. All of the materials related to this report are available in the Supplemental Materials section.
The file containing the details of the usage scenarios, the construction of the test scripts and the test results is available here (20MB). This file may be used with an evaluation copy of the testing software, Web Performance Trainer, to inspect these details. However, the evaluation license is limited to simulate 10 users; therefore the servers cannot be significantly stressed with an evaluation license. If you have other load-testing tools available, the results should be reproducible in those tools with the information we have provided. If you experience difficulty reproducing our results, please contact us.
Servlet Aspects
It is reasonable to expect that different servers will excel at different aspects of servlet execution. This report includes these aspects into the tests:
- raw servlet execution
- static file serving
- session-tracking
- storing and retrieving session data
The Tests
User scenarios
Despite the fact that any performance test can serve only as an approximation of a real-world use case, it was important to choose user scenarios that are at least remotely similar to the kind of usage that will be typical in production deployments. The server statistics for our own website provided inspiration. After a detailed analysis of the paths and pages that are traversed on our website, a few common websites (yahoo, amazon, etc.) were also analyzed. Three user scenarios were chosen for the report:
| scenario | duration | # of pages | page sizes | # resources (images, etc) | resource sizes (bytes) |
|---|---|---|---|---|---|
| Short - represents frequently-used pages (e.g. home pages and corporate portals) and bookmarked pages that are checked occasionally | 10 sec. | 1 | 60k | 30 | 500 (x15)
2,500 (x10) 5,000 (x4) 10,000 |
| Medium - represents a short operation on a website (e.g. a quick product search or shipping status check on an e-commerce site) | 1 min. | 5 | 60k 40k 20k (x3) |
50 | 500 (x27) 2,500 (x14) 5,000 (x4) 10,000 (x5) |
| Long - represents long, involved operations on a website (e.g. placing an order and entering payment and shipping information) | 3 min. | 20 | 60k (x4) 40k (x4) 20k (x12) |
125 | 500 (x72) 2,500 (x29) 5,000 (x4) 10,000 (x20) |
The scenarios take into account a common website property: The first page contains a lot of graphics, many of which are re-used on future pages. Assuming the cache on the browser is enabled these resources will not be requested again. This is why the Short scenario contains 30 resources on a single page and the Medium scenario contains only slightly more resources (50) on 5 pages.
User distribution
Based on the distribution observed in our server statistics, the distribution of the scenarios was chosen (below, middle). During the simulation, each virtual (simulated) user will execute a single scenario repeatedly, until the end of the test. After compensating for the differences in the length of each scenario, the final user distribution could be calculated (below, right).
| scenario | scenario distribution | user distribution |
|---|---|---|
| Short | 40% | 5% |
| Medium | 35% | 30% |
| Long | 25% | 65% |
Bandwidth distribution
Public websites and intranet applications see a distinctively different distributions of user bandwidth. For public websites, 56k to 1Mbit connections are typical. For intranet applications, 10Mbit to 100Mbit are common (this bandwidth is shared). 1Mbit bandwidth per user was selected for simulation purposes. The bandwidth is limited for each virtual user by the testing tool.
Note that with a bandwidth per user of 1Mbit on a 100Mbit network, no more than 100 users could be supported using their full bandwidth (assuming 100% network efficiency - which Ethernet cannot achieve). However, all the scenarios contain significant 'think time' (time between pages) that allows more than 100 users to utilize the 100Mbit bandwidth. None of the servers had the capacity to allow full saturation of the network bandwidth - and therefore does not affect the test results.
Construction of Test Cases
The test case requires a servlet that can return web pages of a specified length and referencing a specified number of external resources (images are used for this simulation). The servlet used in the test provides the required functionality hard-coded in the servlet. The source code for the servlet can be seen here. Once the servlet and necessary resources have been installed (via a WAR file), the test tool is used to record the scenarios interactively using a web browser. Internet Explorer 5.5 was used, but the choice of browser used to record the scenarios should have no effect on the test. Each scenario was recorded over the duration listed above. The testing tool will simulate the scenario using the same think time (delay between pages/URLs) present during the recording.
Session-tracking
In order to simulate how the Servlet Container handles storage and access of session information, the test servlet makes use of the session object (HttpSession). In order emulate a typical application, the amount of information in the session increases with the length of the session. On the first page of each testcase, a session is initiated. For each page visited, a random string is generated and added to the session (HttpSession.setAttribute()). Then, the list of attributes in the session is traversed and each attribute included in the returned page. Cookies are enabled in the browser, since that is the most common usage in real-world conditions.
The complete WAR file deployed to the servers is available here.
Methodology
Testing software
The tests were performed with Web Performance Trainer 2.7 (beta 5 - build 506).
Hardware configuration
Since each server is run on the same machine, the specific hardware used is irrelevant. But since someone will ask: it is a Dell PowerEdge 300 server (850MHz PIII, 512M RAM). Since the most common deployment for these servers will be Windows, the servers are run on Windows 2000 Server, Service Pack 2. Note that the Websphere installer alerted us to a requirement for running on Windows 2000 Service Pack 4. The server has since been upgraded and the Websphere test repeated - there was no discernible effect on the results.
The load-generating machines are run on multiple computers in our test lab running Windows 2000 and XP. The machines all have 100Mb Ethernet adapters.
The load-generators and server are connected via a Netgear FS524 Fast Ethernet Switch. During the tests, this network is isolated from any other networks.
Install, Configure & Run the Server
Servers are all tested in their default configuration.
If the server's installation package is bundled with a JVM, then it is used. If it requires the use of an external JVM, the Sun JDK 1.4.2_03 is used.
The detailed steps used to install, configure and run each server are listed here.
Once the server is running, the servlet used for testing is exercised for one minute, both to verify correct configuration
and to ensure the servlet has been loaded and initialized prior to beginning each test.
Run the tests
The test is run in a ramping fashion, adding 50 additional virtual (simulated) users at random intervals each minute, until the test is complete. Data is collected and summarized by the testing tool at 10 second intervals.
End the test
Each test is ended when the server has exceeded its maximum capacity. When a server has reached its capacity, it will begin to refuse connections. When the error count exceeds 3000, the test is halted.
Measurements
The testing tool calculates several metrics on every URL in the testcase, in addition to page, scenario and overall test statistics. These statistics are sampled on approximately 10 second intervals. For the sake of simplicity, we will focus on a single page as an indicator of overall performance, in addition to a few overall test statistics.
- Users: The number of users being simulated. This is controlled by the load-testing software.
- CPU %: The CPU utilization, as provided by Windows. This value is an instantaneous sample in each period (which will tend to make it noisier than the other metrics).
- Hits/sec: The number of HTTP transactions executed successfully during the sample period.
- Average Page Duration: The average duration of successful web page transactions (specifically, the first page of the Short scenario).
- Errors: The total number of errors detected.
Note that due to randomness inherent in the test and the effects of measurement sampling, small peak and valleys in the plots are not meaningful. The overall trend is what is important.
Changes since the previous version (v1.1)
Changes from v1.1 to v2.0:
- Use of session objects - see above.
- Faster load - The load on the server is increased at a faster rate: 50 new simulated users added per minute, up from 20 in the previous test.
- Shorter sample period - The above changes resulted in each server reaching peak capacity much sooner (~10 minutes vs ~35 minutes). In response, we shortened the sample period from 60 seconds to 10 seconds. A shorter sample period can result in a more "choppy" graph, depending on the response of the server and the inherent randomness in the test.
- Persistent connections - Connections are kept open and reused for multiple requests unless closed by the server.
- Multiple simultaneous connections - Each virtual user more closely emulates a real browser by opening two simultaneous connections to the server.
- Performance of servlets is not tested separately from the performance of serving static resources - the testcase includes both.
- No performance tuning/configuration allowed for any server.
(view the previous version of the report)
Results
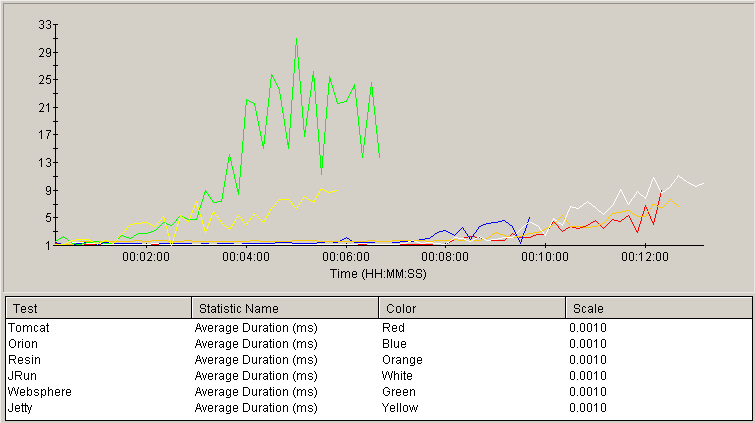
Page load time
The following graph shows the Average Page Duration as measured with each server under an increasing load. The vertical axis represents the page load time, in seconds. This time includes the HTML from the servlet in addition to the static resources. The horizontal axis represents test time, which is proportional to the load on the server (because the number of simulated users is increased at a constant rate of 50 new users per minute). Plots that stay close to the horizontal axis indicate better observed performance under load.
Tomcat, Orion, Resin and JRun performed very closely for the majority of the test. Orion maintained performance similar to the leaders, but did not survive as long. Tomcat and Resin continued neck-and-neck with slightly better response times than JRun, which ran the test slightly longer. Jetty and Websphere performance degraded early in the test.
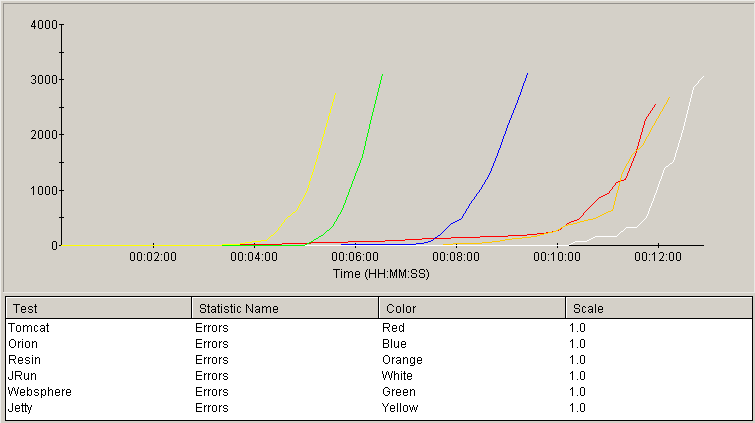
Error count
The next graph shows the cumulative number of errors recorded during the test on the vertical axis, with time (load) on the horizontal axis. These errors are typically connection refused or unexpected socket closure errors. Plots that rise later in the test indicate better robustness.
Tomcat and Resin were, again, neck-and-neck until nearly the 12-minute mark with JRun again out-lasting them by a small margin. Orion exceed the limit in the middle of the pack with Jetty and Websphere exceeding the error limit early in the test.
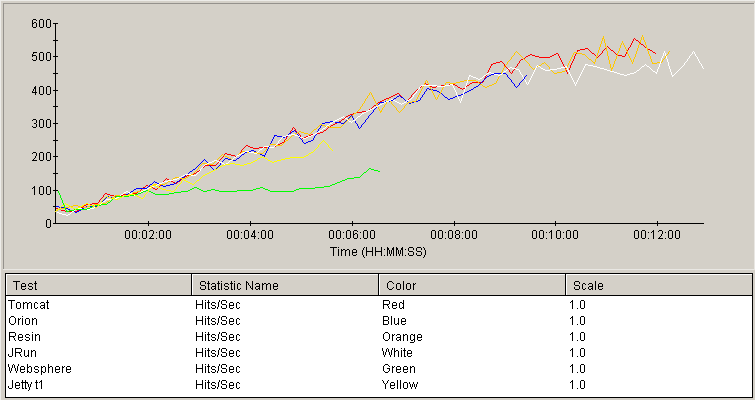
Hits/sec
The Hits/Sec statistic summarizes the previous two data points by measuring the number of requests handled successfully, per unit time. The vertical axis measures hits/sec while the horizontal reflects time (load). The higher graphs represent greater overall throughput capability.
Most of the servers showed very similar performance throughout most of the test. Websphere peaked early in the test. Jetty kept up with the leaders until it exceed the error limit, while Orion continued to scale. Tomcat and Resin demonstrated peak throughput higher than the competitors, although JRun followed closely.
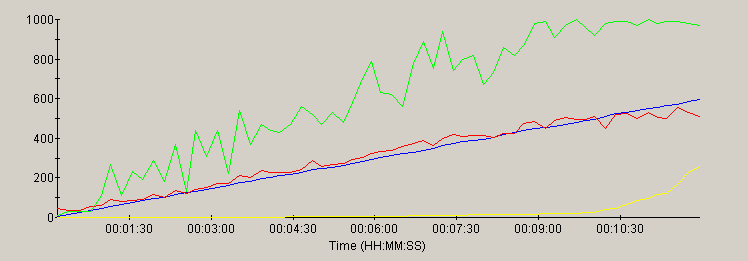
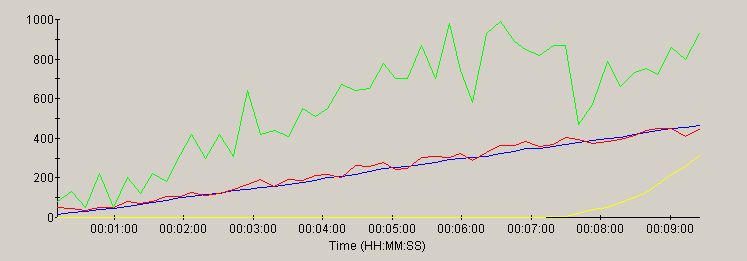
Individual Server performance
This section contains a graph of several key parameters for each server:
| metric | trace color | scale |
|---|---|---|
| Load (users) | blue | 0 to 1000 (users) |
| Throughput | red | 0 to 1000 (hits/sec) |
| Errors | yellow | 0 to 10000 (errors) |
| CPU utilization | green | scale = 0 to 100 (%) |
Most of the servers scaled linearly with the load - as evidenced by the similarity of the load and throughput traces. As CPU peaks at 100%, most of the servers showed a plateau of the throughput trace or a non-linear increase in errors in response to the ever-increasing load.
note: the time scale for each graph reflects the duration of the test for that server. Each server was run for a different duration (see methology).
Tomcat
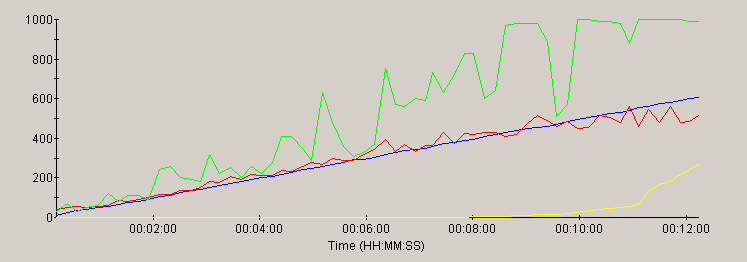
Orion
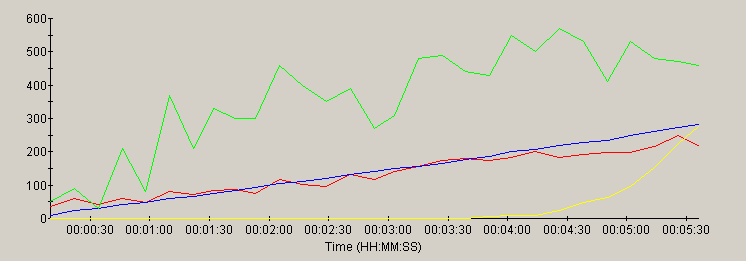
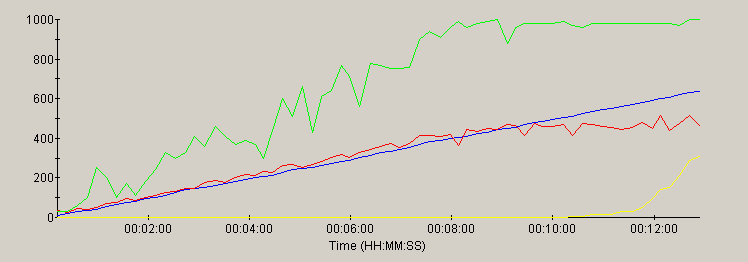
Resin
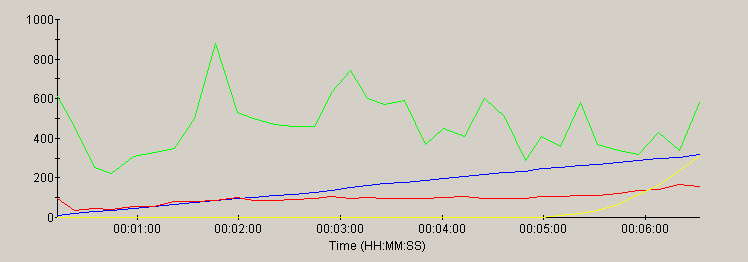
Jetty
WebSphere
JRun
Analysis
Most of the servers in this test performed in a solid, predictable fashion - scaling well under increasing load up to the limits of the CPU. JRun, Tomcat and Resin beat out the competition for handling peak hits/sec. Tomcat and Resin showed higher peak throughput and lower page load times than JRun, which sacrificed these metrics slightly in favor of handling a greater load than the others. Jetty consumed the full CPU a little earlier than the leaders and showed substantially higher page load times as it neared peak capacity.
Jetty did not use the full CPU available to it in the default configuration. It was tested again with a configuration that allowed for more threads, the results are available in Addendum 2.
Orion also never used the full CPU that was available to it - which led me to suspect, based on the performance results from the previous version of this test, that it would rival the leaders if the default configuration allowed the servicing of more simultaneous connections. This theory was confirmed by adding <max-http-connections value=100000> to the Orion configuration, which allowed Orion to survive the test for another 90 seconds, coming close to the performance of Tomcat and Resin. Because this it outside of the test guidelines, the results are not included in this report.
Websphere, also did not use the full CPU during the tests, so I suspected it is capable of better performance, as well. I increased the maximum thread pool size (from 300 to 500). This resulted in a considerable improvement both in page load time and throughput capacity. However, it would still need more tuning to catch up with the rest of the pack. That tuning is beyond the scope of this report.
Future Directions
There are a number of items worthy of further testing. Based on feedback from the community and available resources, we hope to continue to evolve this report to better serve the community.
- resource pools
- SSL
- other operating systems (e.g. Linux, Solaris)
- optimization of server settings (would require some volunteers experienced with tuning each server)
- compare performance with other JVMs (IBM, BEA JRocket, et. al.)
- report on full J2EE performance using Java Adventure Builder Reference Application
Addendum 1 - Resin config
A number of readers have pointed out that there is a very simple configuration option in Resin
that may increase performance drastically. In the resin.conf file, change the value of the
dependency-check-interval parameter from the default value of 2 seconds to the manufacturer
recommendation of 600 seconds. After making this change and repeating the test, the results are
shown in the following chart, which shows both test runs together:
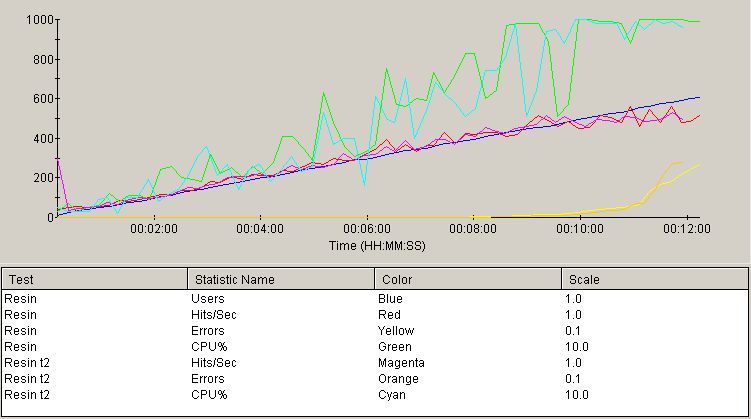
As is obvious from the similarity of the graphs above, the performance impact of adjusting
this setting is negligible in this particular case. Because of the small number of resources
in this test compared to a large-scale project, it is not suprising that this setting has no
effect -- there are not very many resources to check.
Similarly, the results of setting the cache expiration time for static resources (including the .png files used in our testcase) had no discernable effect on the test results.
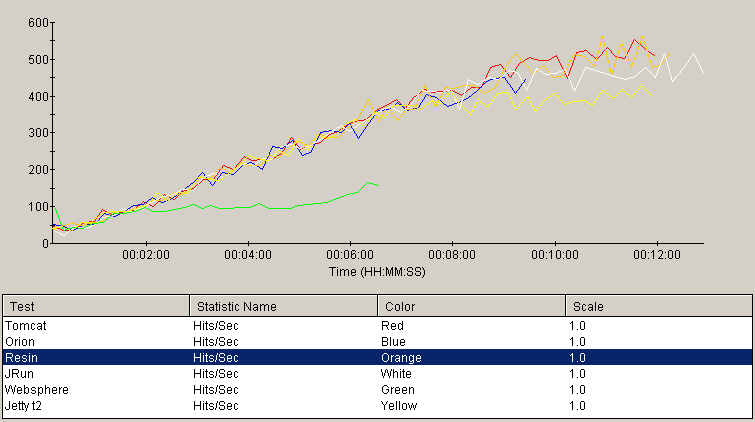
Addendum 2 - Jetty config
After re-testing Jetty with the correct configuration file, it was apparent that Jetty was bound by a design that never allowed it to utilize the full CPU power available to it. The results showed that it barely reached 50% CPU usage. Curious as to the capacity of Jetty when allowed to use the full CPU, it was reconfigured for 150 threads, as recommended some reader feedback. Even with this configuration, Jetty performance fell far short of the competitors and still did not use the full CPU. Jetty was then reconfigured to use up to 500 threads. While it still did not use quite all of the CPU available to it, this allowed Jetty to survive the increasing load for a duration similar to the competitors, as seen in the revised throughput chart, below. The throughput was below the leaders by about 20%, but showed that it scales well, up to its limit.
Feedback & Comments
Comments about this report may be posted at the company blog post.
Version History
- v2.3 - email cleanup (23 jan 09)
- v2.2 - retest Jetty with default configuration. Previous test had erroneously used configuration file from the v1.0 testing. Besides being based on a config file from a previous version of Jetty, it allowed nearly unlimited threads.
- v2.1 - add addendum 1 (6 july, 04)
- v2.0 - include session usage, persistent connections, steeper load ramping, multiple simultaneous connections (29 jun 04)
- v1.1 - make version numbers more prominent (21 nov 02)
- v1.0 - 1st public release (19 nov 02)
- v0.2 - internal review (15 nov 02)
- v0.1 - internal review (8 nov 02)
Supplemental Materials
- Testcase and results (2MB .wpt file (zipped)) for use with Web Performance Trainer load-testing tool
- Source code for the servlet
- WAR file deployed to the servers
- Installation and configuration process followed for the pre-test setup of each server
Get web performance news
Occasional load-testing tips, performance-engineering notes, and product updates. No spam — unsubscribe anytime.