Load Testing Apache with IE8 and Firefox 3.5
How the latest browsers increase speed at the expense of web server performance
Christopher L. Merrill
©2009 Web Performance Inc; v1.0
Introduction
The latest generation of browsers (IE 8.0, Firefox 3.5) have increased the number of simultaneous connections they will open to a single host during the rendering of a web page. For sites that experience simultaneous connection counts that are close to the maximum that the system will accept, increasing adoption of these new browsers will soon cause service interruptions to users of the site. These limitations can appear at numerous points in the architecture of a site, but the most common and most vulnerable limitation is at the web server. Many web servers, such as the Apache Web Server, have relatively low limits on the number of simultaneous connections they will accept. In the case of Apache, there is both a configured limit (in the httpd.conf file) as well as a limit that is hard-coded and compiled into the software.
In this report, we explore the impact on user capacity of an Apache web server under load when the number of connections used by the browser increases from two to six. The impact on every site will be different, but we hope that the results from this test will give webste administrators a rule-of-thumb that will help them estimate how soon they will need to address this problem. The goal is to measure the relative decrease in capacity when 6-connection-limited browsers are used compared with 2-connection-limited browsers.
Testing Considerations
The Apache Web Server has both configuration and compiled-in limits to the number of simulatenous connections it will accept. For our tests, we use the default Apache installation as distributed with Red Hat Enterprise Linux 5.0 (and CentOS 5.0). We chose this configuration because of any subset of the deployed configurations, the default configuration will be the most prevelant. The specific configuration chosen is largely irrelevant because the goal is to analyze the net change in capacity between different applied loads against a typical configuration.
Test Setup
Load Test Configuration
The testcase consists of a user browsing 10 pages of a typical
static web site over a 2 minute period. The 10 pages included 141 URLs
(CSS, images, etc) as well as 2 relatively large pages (335kB and
1.1MB). The total size of the testcase was just under 2MB (including
HTTP overhead).
We tested under real-world network conditions: the target server is on the west coast of the USA while the load was generated from the east coast. Three tests under each browser configuration (total of six tests) were performed back-to-back to minimize the effects from daily fluctuations of Internet traffic patterns. The most average result for each browser configuration was selected. Some differences can be seen in each of the results, but were well within our tolerances for a rule-of-thumb conclusion.
Several sizing tests were
used to estimate the capacity prior to the six tests. The test was then
configured to increase users during the test in a stepped
ramp
configuration. Each user simulated 5Mbps of download bandwidth and
randomly varied the between-page think times from 50% to 200% of the
recorded think times. The test results quoted in this report ramped
quickly to a load well below the performance limits and then ramped
slowly (10 users over 2 minutes), then holding one minute for
steady-state data analysis.
The capacity of the site is measured by the number of simultaneous
users serviced while meeting the performance goals of the site. Each
page has a 4-second performance goal, except for the largest, which has
a 6-second goal. In addition, the test has a page failure rate goal of
1.0% (which was never exceeded during the tests). At each user level,
the collected metrics are analyzed against those goals - in this case
the average page duration and average wait time must not exceed the
duration goal for each page. The site is said to meet the goals of the
site only if each performance goal is met at that user level.
Server Configuration
Apache 2.2.3 on CentOS 5.0 (pre-fork MPM) on a 2x1.86GHz Core 2 Duo with 1G RAM.
The prefork MPM configuration settings were left to the default settings:
StartServers       8
MinSpareServers    5
MaxSpareServers   20
ServerLimit      256
MaxClients       256
MaxRequestsPerChild  4000
Load Generator Configuration
Load Tester version 4.0.7621 was used to generate load against the server, gather metrics, analyze results and generate the report (including the charts shown below). The load engine was running on a 2x1.86GHz Core 2 Duo with 1G RAM.
Results
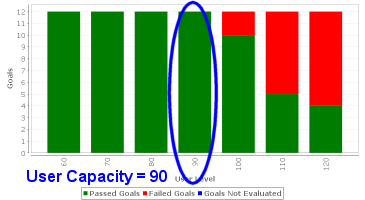
The estimated user capacity, as calculated by the Load Tester software, is 230 users when the clients use 2 connections but drops to 90 when the client uses 6 connections - a decrease of ~60%.
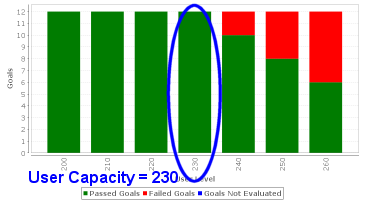
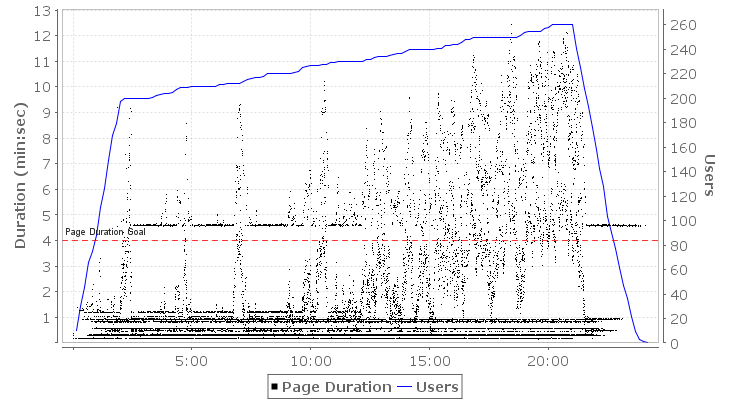
In each case, the user capacity was limited by one or more pages failing the configured duration goals - which means that the average duration recorded in a 10-second sample period exceeded the goal configured for the page. The following charts show the detailed page durations for each of the two tests. The tests exhibited a very similar pattern of degradation. Note that only the 4-second goal is marked on the chart - which was the duration goal configured for 10 of the 11 pages (the last page was much larger and had a 6-second duration goal).
In the chart below (2 connections/client) it is easy to see where the configured connection limitations are encountered - indicated by sharp peaks in the page durations. This behavior is evident at 200-220 users, well before the system failed to meet the performance goals.
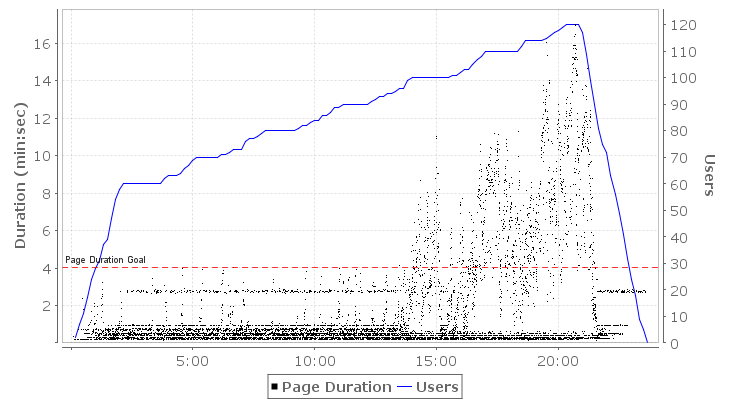
In the 6 connections/client test (below), two distinct differences
can be seen. First, the page durations are much lower - because the
browser can use more connections to fetch resources - thus reducing the
effects of network latency. This is the reason that the browser
manufacturers have increased the connection limits. Second, the effects
of the connection limitation are less notable prior to the failure of
the performance goals.
Conclusions
In our evaluation, the capacity of an Apache server, measured by compliance with performance goals under load, was reduced 60% when visited exclusively by the latest generation of browsers (for example, IE 8.0 and Firefox 3.5). When browsers used 6 connections per host, compared to 2 connections per host in previous generations of browsers, the default connection limits were exceeded at much lower user levels. Administrators of Apache web servers (or any other server that has a relatively low fixed connection limit) should evaluate how close their servers are to those connection limits today and increase those limits as the adoption of new browsers raises the connection demand on the servers.
References
Version
History
v1.0 - 1st public release (October 8, 2009)
Get web performance news
Occasional load-testing tips, performance-engineering notes, and product updates. No spam — unsubscribe anytime.