SharePoint™ Load Testing Services Case Study
Christopher L Merrill
©2009 Web Performance, Inc.
v1.0 - Feb 18, 2009
Database Tuning
Early in the testing, Web Performance suspected that the database was the bottleneck. However, an analysis of database performance during the tests by both the customers in-house DBAs as well as Microsoft DBAs determined that locking contention was at low levels and the database was performing well. This had put the focus on the SharePoint™ servers. It now seemed prudent to return our attention to the database.
After additional testing and data gathering, Microsoft Support engineers found that contention on tempdb allocations within SQL Server was causing delays processing queries from SharePoint™. This problem is described in the Microsoft Knowledge Base (#328551).
The fix requires creating additional tempdb databases within SQL Server (1 for each processor) and enabling a startup parameter (-T1118) that instructs SQL Server to use a round-robin tempdb allocation strategy. This will reduce resource allocation contention in the tempdb database to improve performance on complex queries.
After making this change, load tests indicated that the system was able to sustain 15 pages/sec (650 users) for 2 hours on a single server. Web page performance had improved - average page durations were down to the 2-4 second range. Specific changes to custom SharePoint™ components and some additional database optimizations suggested by Microsoft Support brought average page durations under 1 second.
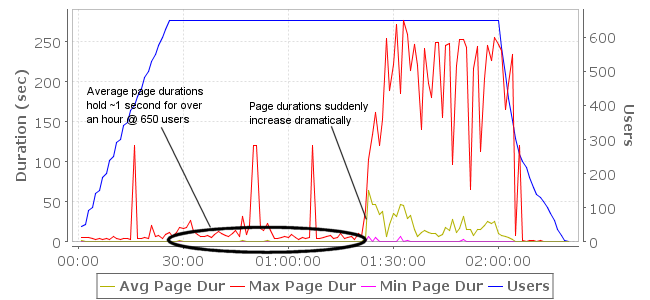
figure 6: Page durations were greatly improved, but performance was not stable
While we had achieved a fast, stable system on a small subset of pages, the instability re-appeared when we re-introduced the remaining 3 testcases into the mix. The behavior appeared after roughly 80 minutes of operation at load. It was not as bad this time – rather than stalling, throughput would suddenly drop by 30-50% and then oscillate up and down wildly:
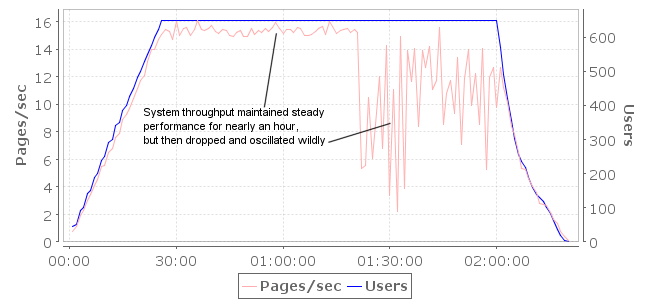
figure 7: System throughput is good, but degrades severely and unpredictably
There was some debate at this point if the SharePoint™ Server or the SQL Server was the culprit. We recalled the “rebooting the database fixes the problem” discovery from previous testing and brought this to the attention of the Microsoft Support engineers. We also found that if the load test was stopped when the servers were in a degraded state and restarted within a few minutes, the degradation would continue, even at very low load levels. Further diagnostics around these symptoms revealed that once the system performance had degraded significantly, clearing the query plan cache in SQL Server (via DBCC FREEPROCCACHE) would restore system performance almost immediately. Unfortunately the fix was not permanent – the performance degraded again within a short period of time.
This led the Microsoft engineers to a Microsoft Knowledge Base article (#927396) that indicated problems with the size of the TokenAndPermUserStore cache in SQL Server. When the server has a large amount of physical memory (in this case 32G) and the rate of random dynamic queries is high, the number of entries in this cache grows rapidly. As the cache grows, the time required to traverse and cleanup the cache can be substantial. Because access to this cache is single-threaded, queries can pile up behind each other waiting for the cleanup to complete. This slows performance and prevents a multi-processor system from scaling as expected. This was remedied by starting SQL Server with a “-T4618” parameter (note this is not one of the listed solutions for this issue – it was provided by a Microsoft Support Engineer) which limits the TokenAndPermUserStore cache size.
After the above fix was applied, the next load test of the system showed steady performance with 15 pages/sec and APDs under 1 second, supporting 650 concurrent users for 10 hours. However, in a subsequent load test, errors started appearing in the pages indicating that SharePoint™ was unable to render many web parts on the page: “Arithmetic operation resulted in an overflow”. Microsoft quickly traced this to a bug in a SharePoint™ cache implementation that was fixed by reducing the SharePoint™ Security Token Cache size. Search the knowledge base for the article “Object cache throws Integer Overflow exceptions when cache size > 2000” for more details.
With the above fix applied and tested, the system was ready for a longer stress test to judge the stability of the system over longer periods. The next load test ran for 48 hours at 650 users. The system performed well – easily satisfying the performance requirement with only a single SharePoint™ web server. No degradation of performance was observed. Further testing with all three SharePoint™ servers and higher load levels showed similar success.
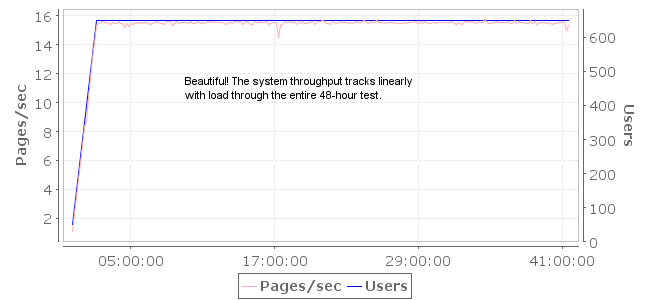
figure 8: A successful 48-hour test at 650 users