SharePoint™ Load Testing Services Case Study
Christopher L Merrill
©2009 Web Performance, Inc.
v1.0 - Feb 18, 2009
Initial Tests
A few days later, we were ready to execute the first tests of the site. Initial tests were not promising. Under a simulated load of 100 simultaneous users, the system returned pages, on average, in less than 3 seconds – but that was only after the first group of users had passed the homepage and login steps.
During the ramp-up, the average page durations (APDs) peaked over 12 seconds. After the second group of users was added (for a total of 200), average page durations exceeded 20 seconds, as shown in this chart:
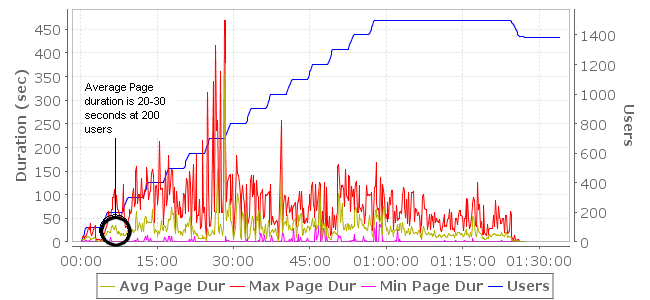
figure 1: Initial testing shows poor performance - 20-30 second page durations at 200 users
The metrics gathered during the test (via Load Tester's Server Monitoring Agents) indicated that hardware was not the bottleneck - neither CPU, memory or disk were taxed during the tests. A series of tests and subsequent investigations indicated that the network and load balancer were not the limiting factor either.
Next, we isolated each SharePoint™ web server in the cluster and tested them individually. The tests revealed a number of differences between the servers. For instance, one server was not compressing the page content. More importantly, we found that running with only a single SharePoint™ web server resulted in better performance (average page durations under 6 seconds) up to 300 users – three times the capacity of the system with 3 web servers (note that this test ran for a shorter period – thus the change in scale on the Users axis and the time axis).
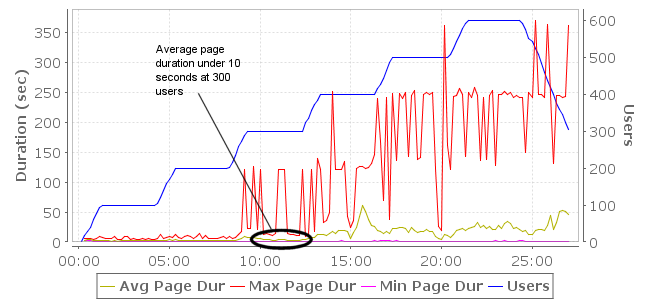
figure 2: A single server performed better, but performance is still not acceptable
We also noted that CPU utilization was not scaling linearly with the applied user load. At ~400 users, the CPU utilization peaked on the web and database servers at ~60% and ~30% respectively:
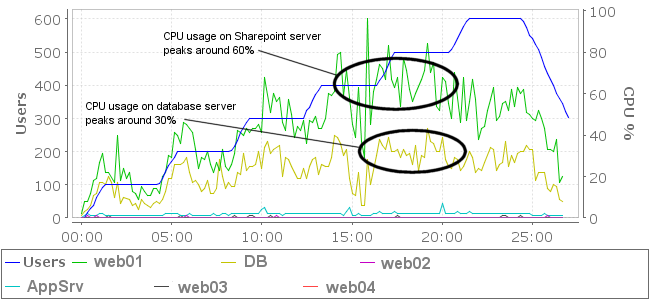
figure 3: CPU utilization levels off after 400 users
Additional user load did not raise these levels – in fact, CPU usage declined as more load was added. After the peak, additional load did not raise the key throughput metrics, such as hits/sec, pages/sec and bytes/sec. The server metrics did not indicate a bottleneck in any other hardware category (network, memory or disk). This left software or software configuration as the most likely limiting factor. The most common culprits in this situation are connection pools, thread pools, resource contention and database locking.
Get web performance news
Occasional load-testing tips, performance-engineering notes, and product updates. No spam — unsubscribe anytime.