Comparing Apache Tomcat Performance Across Platforms
Part 2: Performance and Distinct Error Handling under Computational Load
Frank C. Ziglar
©2006 Web Performance, Inc., v. 1.1
Abstract
This article measures performance information in order to distinguish the differences evident between the Windows® and Linux platforms. Testing performed against our Windows server gave users marginally shorter wait times by electing to turn away some traffic. Our Linux server, however, was able to scale to serving a greater number of users with reasonable responsiveness before it's maximum capacity was reached.
Introduction
In Part 1 of this article, we examined the performance differences between the Windows and Linux platforms, noting their behavioral differences as they approached capacity. This limitation was easily remedied by increasing the memory available to Tomcat. Here, we will present the behavior of the servers after this change was made to their configuration.
Part 2 follows the same guidelines and testing procedure, except where noted, as the previous edition. For brevity, a description of the tests and procedure is included only in the earlier edition.
Testing Procedure
Test case recording, virtual user simulation, and data gathering were all managed by the testing tool. The testing tool used for this report was Web Performance Trainer 2.8, build 629.
Servlet Container Preparation
Tomcat was installed following the procedure outlined in the earlier edition of the Servlet Report. The only difference made here was to increase the JVM memory limits. Since each server was equipped with 512 MB of RAM, the new memory configuration setting was arbitrarily chosen to have a 200 MB initial size, with a maximum of up to 384 MB. Under Windows, the settings were entered directly into the configuration manager applet installed with Tomcat. Under Linux, the same effect was achieved by specifying the JVM parameters in the CATALINA_OPTS variable.
Results
Throughput
Our first measurement of interest is roughly how much throughput the server was able to sustain under an increasing load. This measurement is taken from the total Megabytes of HTTP traffic, and does not consider lower level implementation overhead.
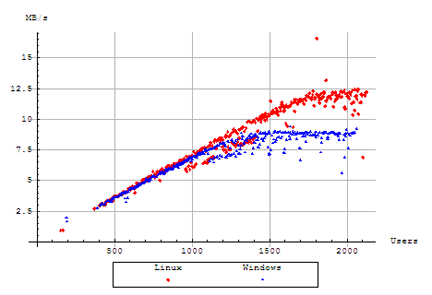
The test was terminated after 100 minutes, after the plateau made it evident that the server was unable to provide any improvement in responsiveness to further users. Since our load is being distributed from multiple engines connected to a 1 GbE switch, the throughput of both servers is well below the total ethernet bandwidth of our testing lab, and can be ruled out as a significant limiting factor for these results. The leveling out of the throughput indicates the server has reached it's absolute capacity to serve data, and is unable to scale further. The maximum throughput measured here is approximately 8.8 MB/s for our Windows server, compared to 12.0 MB/s for our Linux server. It appears evident that our Linux server was able to scale to the needs of many more users than our Windows server was able to.
CPU Utilization
The CPU Utilization will give some insight as to how well the server was able to cope with the increasing load. Each server in the test was equipped with a single physical CPU with HT Technology enabled. This graph is then an average of the processor load of the two reported virtual CPUs.
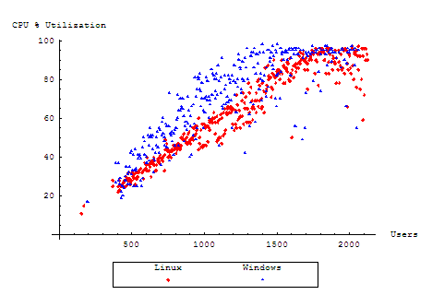
We see here that our Windows server starts out consuming more CPU time earlier during the test. As more users are added to the test, eventually performance becomes processor bound, and our server is too computationally overwhelmed to continue to accept users. Our Linux server, too, becomes fated to the same end, but lasts longer before CPU time is completely exhausted.
Errors / second
During our testing, the only errors that propagated their way to the Virtual User were transmission errors occurring when a user would attempt to open a connection to the server. To the end user, this means their web browser will display an error message, usually similar to "Connection refused by server". Every page returned during this test was a complete page, and not an error page from the server.
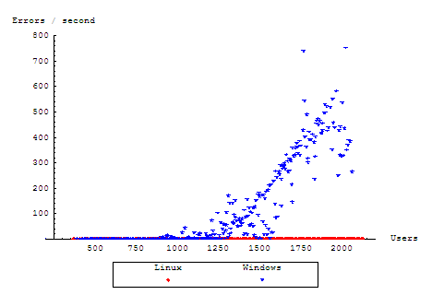
Here, we notice a trend that our Windows server is electing to refuse connections instead of attempting to service them. Our Linux server is not completely without error, but rarely exceeds a consistent rate of over 1 error per second, enough to account for over 180 errors logged after our 100 minute test. However, this number is still negligible when our Windows server is turning away more traffic per second than our Linux server turned away during the entire test.
Hits / sec
Our next step is to examine how responsive our server is under the increasing level of load being generated. This measurement will be in the number of responses per second of HTTP traffic. We would then anticipate that under an increasing amount of traffic, we should see an increasing number of completed responses from the server.
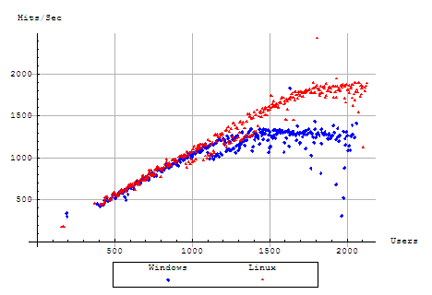
We recognize this graph from our examination of the throughput of the servers. We see that once again that the two servers are able to maintain a relatively even and competitive pace with each other, until our Windows server begins to slow down under increasing load at approximately 1,200 users, and levels out at its capacity around 1,300 users. Our Linux server, too, levels out, as the user count continues to rise, but only after it has been able to scale to nearly 1,800 users. The increase in user capacity allows our Linux server to serve at slightly over 1,800 Hits / sec, compared to the 1,400 Hits / sec reached by our Windows server.
Duration
In the last phase of this category, we concern ourselves with how long is a user going to need to set aside in order to complete their task. We are measuring the full time until a response was received from a server, waiting until it has arrived before moving onto the next page of the test.
For the duration times for a business case, the baseline for each graph is defined as the amount of time the user spends "interacting" with the page before moving on to the next page. The simulated time spent by the user on the last page is therefore omitted.
The duration graphs here show the full range of measured durations during a given interval (dark background), with the averages on top (highlighted points).
Complete Scenario Durations
We'll start by examining the amount of time the user spent working their way through the entire test case, up to the response of the last transaction from the server. Please note that each column shows a series of graphs occurring roughly concurrently. Hence, the number of users for each graph is measured for the number of users in a specific case, and not the total hitting the entire server (you may refer to User Distribution in Part 1 if necessary).
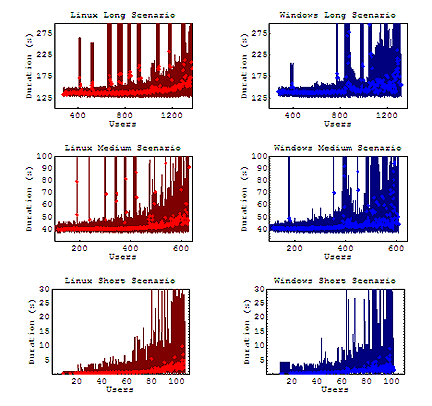
In each figure, we have trimmed off the extreme outlying maximum durations. These outliers were measured as high as 10 minutes in the long scenario, 7 minutes in the medium scenario, and 100 seconds in the short scenario. However, the general trend seems to emerge: longer scenarios with more pages are more likely to get stuck on a resource that did not receive a prompt response, and will see a greater increase in the average duration. Overall, our Windows server maintained a somewhat even average duration under load, though this number appears to jitter more under increasing load. Our Linux server shows a gradually increasing average duration under load once the capacity of the server has been reached. Both servers show that the potential maximum duration observed will grow with the amount of load on the server.
Static & Dynamic Content
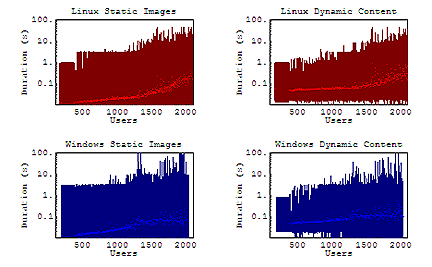
Evidently, for the entire duration of the test, the average request for any given URL used was followed by a practically instantaneous response from the server. Our maximum durations here are much more pronounced than those for our static URLs during lower user counts, but this is only because there are significantly more static URLs in each test to potentially return with a maximum duration. However, we notice that the maximum duration for URLs has a greater tendency to increase for our Linux server under high load. Presumably, since our average durations are being returned at a quick rate, the perceived long durations for each test are the consequence of users getting "stuck" on a resource that has been delayed to the maximum duration.
Capacity
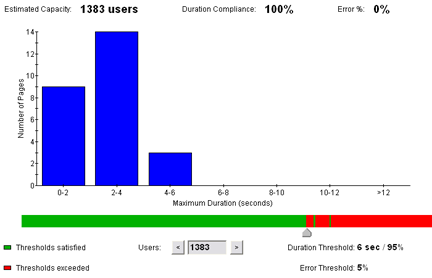
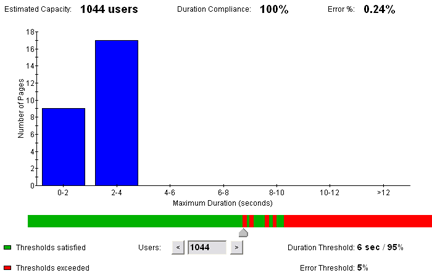
When we discussed our error counts, we mentioned that the only errors were purely transmission errors with the server. However, with the delays we have seen, we also need to impose some restrictions that the server should be able to respond within a reasonable amount of time. With this in mind, we will use Web Performance Trainer to look at the total capacity of the server, and focus on how much load can be handled where at least 95% of the users have a total page duration of 6 seconds or less, and with no more than 1% of the responses indicating errors. This value appears somewhat smaller than we might expect from looking at the scalability from the server. Despite an increasing throughput from the server under higher load, an increasing percentage of users are likely to hit significant delays or connection failures as the load increases. Hence, we can use this analysis to evaluate the realistic capacity of the servers, given the parameters we have provided above.
Linux Capacity
Windows Capacity
Analysis
Here, we have given Tomcat the opportunity to compete when installed on two different platforms. We see that the average duration of each URL, even under extensive load, remains relatively instantaneous for both servers. However, our Linux server slowly has an increasing number of URLs that do not get serviced quickly, and delays service for longer periods of time than our Windows server, when forced under load. By contrast, our Windows server shows somewhat shorter durations per URL by instead turning away traffic that it is unable to handle. Despite this quick but incomplete response on some resources, many users will still find themselves waiting on another resource that was not serviced as promptly.
From the administrator's stand point, our Linux server did not tie up it's CPU resources as early, and was able to service many more connections overall. However, some of those connections were consistently delayed, leaving users waiting on the other end. However, even with some normal delays in consideration, our Linux server was still able to serve more users than it's Windows counterpart.
Feedback & Comments
Comments about this report may be posted at the company blog post.
Get web performance news
Occasional load-testing tips, performance-engineering notes, and product updates. No spam — unsubscribe anytime.