Comparing Apache Tomcat Performance Across Platforms
Part 1: Performance and Distinct Error Handling under Memory Load
Frank C. Ziglar
©2006 Web Performance, Inc., v 1.1
Abstract
This first part of this article measures performance information in order to distinguish the differences evident between the Windows® and Linux platforms. We find that given comparable hardware the performance differences introduced are almost trivial. When the server was pressed to capacity, our Windows installation was forced turn away some traffic with minimal alteration in serviced performance, whereas our Linux installation elected to service nearly all connections at the cost of introducing latency. However, prior to reaching capacity, our Linux server appeared on average to be capable of servicing connections at a slightly faster rate than our Windows server.
Introduction
Sun's release of their J2EE specifications has been followed by enthusiastic developers crafting powerful applications which can be seen on the web in businesses of every size. The result is one very hot topic continually focused on by many developer groups, but mature enough to be well known in all aspects of the industry. Some of the first questions that must be asked with any new project remain: what is the best starting point, and how should this application be deployed? Here, we would like to provide some guide as to what trade-offs can be expected before that decision is made.
Earlier editions of this report present some comparative results between the different servlet containers available. The response and feedback have been tremendous, and there has been no shortage of suggestions for comparing function X against Y and Z. However, with J2EE delivering platform independence, many people (including myself) have expressed interest in determining just how significant a difference is present between various platforms. For this phase, we will take a look at one of the most popular servlet containers, Apache Tomcat, operating on the two most common platforms in general use: Windows and Linux.
For simplicity, this article will be broken into two separate parts. Here, we will discuss a simplistic scenario, quickly leading the servers into a performance limitation. In Part 2, we will also examine the performance of the platforms after this limitation is lifted.
Testing Goals
Usage Scenario
This article is intended to evaluate the servlet performance of a stand-alone server. This is expected to be applicable to small-to-medium projects that are deploying applications in departmental or small corporate environments. It is not intended to represent the performance of the server in a clustered or distributed environment. Nor is it expected to reflect the performance of a server that has been highly optimized to achieve maximum performance for a particular application.
Difficulties of Benchmarking
Our choice of benchmarks for this report is merely a smoothed over average of samples we have observed in the wild. Each application will stress different aspects, or have different expectations of its users. Some applications will run better on some servers than others. Well aware of the danger of misleading benchmarks, there is no expectation that this report will reflect the performance of any particular application, or class of applications, that might be deployed in the real world. Hopefully, this report instead provides data that helps the reader weigh the performance trade-offs of the platforms.
Numerical values must also be considered with a margin of error in mind. When we compare timing measurements that are nearly equal in value, the faster and slower responses could easily exchange places with just the slightest fluctuation. Upsets could be derived from practically any cause imaginable. As a brief example, one source might be software configurations including or excluding background / idle processes. Alternatively, minor revision changes in loaded applications / libraries could have the same effect. On the hardware side, selection of just the next faster or slower marketed processor would have an effect on the processor to IO performance ratio, which could upset subtleties in how the platform is managing internal semantics.
Raw Numbers vs. Relative Performance
Due to the variability of application and hardware configurations, this report can not tell you how many users your application will be able to handle in your environment (which is why we sell a product for exactly that purpose!). This report will produce numbers such as hits/sec and average page duration, but the raw numbers have little value by themselves. Only when the statistics are compared against the other servers do they provide valuable insight on which to make performance judgments.
It may seem obvious to some, but it is important to reinforce this point: If the data for this test indicates that Server X can serve 200 hits/sec with an average duration under 2 seconds, there is no correlation to the number of hits/sec that your application will be capable of. The data presented here for one server is only useful for comparison against the other, under the identical test conditions of our test lab. Additionally, please note the hardware used for the server during these tests (see Server Hardware, below) is by no means a state-of-the-art configuration.
Reproducible Results
No matter how this testing is performed, someone will scream "Foul Play!" A primary goal of this effort is a test that is easily duplicated by anyone else who wants to try. No doubt the exact numbers will not be duplicated, due to differences in hardware and measurement technique, but the relative differences between the servers should be reproducible. All of the materials related to this report in the Supplemental Materials section.
Configuration
Philosophy
Ideally, we would like to give the community some insight into the relative differences between the platforms, so that one might be able to infer some information into their own application. For this purpose, we have intentionally used any default values provided, except where noted otherwise. We feel that while performance tuning will inevitably become a part of an app that is not meeting expectations, our testing strategy provides an effective baseline guide.
First, by using default settings, our test results can be interpreted with a much broader range than it would had we tuned our application server specifically for our test app. Second, there is practically an infinite number of permutations of just those options that are related to the server's and servlet container's functionality. Evaluating permutations of even a few of these settings can make our results too long to effectively digest. Third, if the same functionality can be obtained by setting twice as many options (hence taking twice as much time to configure), the question of testing fairness could easily be argued.
Server Software
The two OSs utilized during this test were Microsoft Windows Server 2003 ("Windows"), and CentOS 4.2 x86_64 ("Linux"). With Windows installed, it was permitted to use Windows Update to install the most recent service packs and updates as of November 16, 2005. Our Linux copy was installed via CDs burned from the publicly available ISO images. The YUM Updater was then allowed to update all installed packages to the latest stable versions as of November 15, 2005.
Server Hardware
As has been mentioned during our testing goals, our focus in this report is to outline generalizations and trends differentiating the two platforms. However, we will first introduce the hardware specifications here for those interested in how the quantitative values were obtained.
For this test, two servers were used, each with identical hardware. Each was a Dell PowerEdge SC1420. The installed hardware specifications on this model:
| Processor | One Intel Xeon 2.8 GHz with HT Technology |
|---|---|
| Memory | 512 MB |
| Disk Drive | One 40 GB SATA disk drive |
| Ethernet | One 1 GbE ethernet interface. |
Testing Laboratory
Each workstation used during the test was connected directly to a Dell PowerConnect 2324 switch. This switch offers two GbE ethernet ports, to which the servers were connected, as well as 24 100 MbE ports.
During each test, the server not being tested acted as the test controller. Five additional workstations were used by the load controller for additional load generation in order to minimize timing discrepancies. Each load generating workstation was connected directly to the same switch through one of its 100 MbE ports.
The Tests
User Scenarios
Despite the fact that any performance test can serve only as an approximation of a real-world use case, it was important to choose user scenarios that are at least remotely similar to the kind of usage that will be typical in production deployments. The server statistics for our own website provided inspiration. After a detailed analysis of the paths and pages that are traversed on our website, a few common websites (yahoo, amazon, etc.) were also analyzed. Three user scenarios were chosen for the report:
| scenario | duration | # of pages | page sizes | # resources (images, etc) | resource sizes |
|---|---|---|---|---|---|
| Short – represents frequently-used pages (e.g. home pages, corporate portals, and bookmarked pages that are checked occasionally). | 10 sec. | 1 | 60 KB | 30 |
500 B (x15) 2.5 KB (x10) 5.0 KB (x4) 10.0 KB |
| Medium – represents a short operation on a website (e.g. a quick product search or shipping status check on an e-commerce site) | 1 min. | 5 |
60 KB 40 KB 20 KB (x3) |
50 |
500 B (x27) 2.5 KB (x14) 5.0 KB (x4) 10.0 KB (x5) |
| Long – represents long, involved operations on a website (e.g. placing an order and entering payment and shipping information) | 3 min. | 20 |
60 KB (x4) 40 KB (x4) 20 KB (x12) |
125 |
500 B (x72) 2.5 KB (x29) 5.0 KB (x4) 10.0 KB (x20) |
User Distribution
Based on the distribution observed in our server statistics, the distribution of the scenarios was chosen (below, middle). During the simulation, each virtual (simulated) user will execute a single scenario repeatedly, until the end of the test. After compensating for the differences in the length of each scenario, the final user distribution could be calculated (below, right).
| scenario | scenario distribution | user distribution |
|---|---|---|
| short | 40% | 5% |
| medium | 35% | 30% |
| long | 25% | 65% |
Bandwidth Distribution
Public websites and intranet applications see a distinctively different distributions of user bandwidth. For public websites, 56k to 4Mbit connections are typical. For intranet applications, 10Mbit to 100Mbit are common (this bandwidth is shared). A maximum of 10Mbit bandwidth per user was selected for simulation purposes. The bandwidth is limited for each virtual user by the testing tool.
Note that with a bandwidth per user of 10Mbit on a 100Mbit network, no more than 10 users could be supported using their full bandwidth (assuming 100% network efficiency - which Ethernet cannot achieve). However, all the scenarios contain significant "think time" (time between pages) that allows more than 1,000 users to utilize the 100Mbit bandwidth. Each test was stopped before any indications were given that the throughput capacity had been reach for our lab, in order to ensure that our measurements are an accurate gauge of the performance of the server itself.
Construction of Test Cases
The test case requires a servlet that can return web pages of a specified length and referencing a specified number of external resources (images are used for this simulation). The servlet used in the test provides the required functionality hard-coded in the servlet. The source code for the servlet is publicly available in the ContainerBenchmark.java file. Once the servlet and necessary resources have been installed (via a WAR file), the test tool is used to record the scenarios interactively using a web browser. Opera 8.01 was used, but the choice of browser used to record the scenarios should have no effect on the test. Each scenario was recorded over the duration listed above. The testing tool was configured to simulate approximately an equal share of "think time" between each page, lingering slightly longer on the last page before restarting the test.
Testing Procedure
Test case recording, virtual user simulation, and data gathering were all managed by the testing tool. The testing tool used for this report was Web Performance Trainer 2.8, build 629.
Servlet Container Preparation
In our simple testing environment, all operations were carried out while logged in with full Administrative privileges. No further security restrictions were manually applied to the servlet's operating environment.
The first required component to be installed was the JRE. Sun's JRE, version 1.5.0 - update 5, was selected and installed for each platform with the executable installer.
After the JVM was installed, Tomcat 5.5.12 was installed. The Windows download included another executable installer, which automated the process. The Linux installation was carried out by simply unpacking the compressed archive, and then setting the necessary CATALINA_HOME and JAVA_HOME variables from the command line before using the included shell scripts to start the container.
Tomcat 5.5.12 supports linkages to the APR library for acceleration, but for simplicity, both servers were installed and configured with this option disabled. Testing was performed by connecting directly to Tomcat, and not through any additional software connector or proxy.
Once the servlet container was successfully running, the WAR file with our test application was copied to Tomcat's webapps folder and auto-deployed.
Record the Test
Once the first servlet container had been installed, it was possible to record one case of a user using their web browser to step through each page of the test. Once the recording was made, the test was configured as we have mentioned above.
Run the Test
Each test was preceded by a brief ramp from five to eleven users stepping through each page of the test. This warm-up ensured that the server had an opportunity to fully initialize any basic resources fundamental to the test. The actual test was started shortly afterwords. In order to focus on meaningful results, the tests quickly ramped up to 275 virtual users within the first minute, and thereafter increased by 11 virtual users per minute. Each test was allowed to run for 90 minutes, after which it was terminated. At the end of each test, idle time was allotted for the servlet container to be restarted, and allow all lingering resources to be disposed.
Results
With our servers configured as we have outlined above, we may now proceed to examining the results of the test. The servers appeared to quickly hit a VM memory restriction. Results upon remedying this error should become available in part two of this article. The interesting aspect of this test is that we see the servers behave quite differently when forced to serve beyond their capacity.
We've selected six categories of data to collect and present here:
- Throughput: How much response bandwidth the server is able to generate.
- CPU Utilization: How taxed is the server becoming.
- Errors per Second: How frequently is the server unable to respond.
- Requests per Second: At what rate is the web browser making requests from the server.
- Hits per Second: At what rate is the server responding to requests from users.
- Duration: How long can a user expect to wait before the page is complete.
Throughput
We start off with how much throughput the server was able to sustain under an increasing load. This measurement is taken from the total MegaBytes of HTTP traffic, and does not consider lower level implementation overhead.
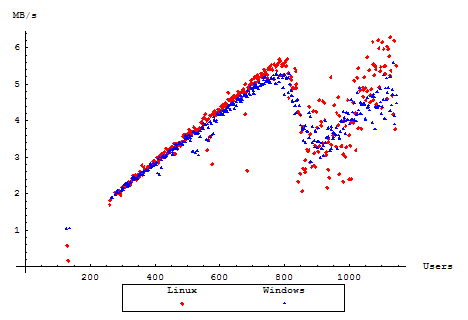
The sudden drop-off in traffic is somewhat surprising. Examining the Tomcat server logs for Windows displays some OutOfMemoryExceptions as the server is pressed under increasing load. The same logs for Linux, however, revealed no illuminating information.
CPU Utilization
The CPU Utilization will give some insight as to how well the server was able to cope with the increasing load, and whether or not the server seemed too computationally overwhelmed to process any further users. Each server in the test was equipped with one CPU with HT Technology enabled. For simplicity, we will then examine an average of the processor load of the two reported virtual CPUs.
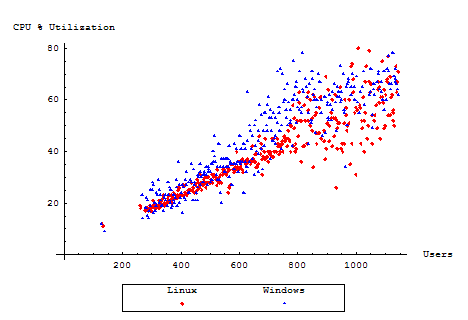
Evidently, both servers continued to consume the CPU linearly with load, up to roughly equal proportions. However, the load eases off just slightly, but only slightly, during the server's slump in throughput. As the throughput once again begins to increase, the CPU increases as well.
The still relatively high CPU utilization during the throughput slump confirms our suspicion that Tomcat and the JVM are still chugging along, evidently running memory management or optimization cycles.
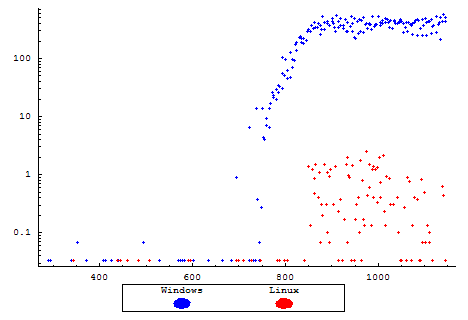
Errors per second
During our testing, the only errors that made themselves evident to the end user were transmission errors occurring when a user would attempt to open a connection to the server. To them, this means their web browser will display an error message, usually similar to "Connection refused by server". Every page returned during this test was a complete page, and not an error page from the server. Please note that since the Windows server showed significantly more tendency towards generating errors, this plot is scaled logarithmically.
Server Responsiveness
Now, let us examine the number of completed requests per second as measured by the testing tool. This number is permitted to decline with the number of users as the server becomes unresponsive and users are forced to wait before they can make another request. Under normal circumstances however, the number of requests should be equal to the number of responses received, and should overall be directly proportional to the total throughput of the server.
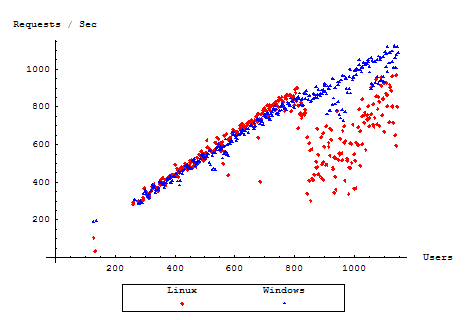
Interestingly, our Windows server here elects to maintain a consistent level of responsiveness to the user, preventing the web browser from having to wait a significant amount of time for a response. During our performance slump, we note that the server simply refuses further connections from the user, giving them an immediate error. By contrast, our Linux server appears accept the connection, and only responding when it is free to do so completely.
Hits per Second
After having seen how quickly requests were being issued to the server, let us move to the response rate from the server. The Hits per Second measures the rate of completed HTTP responses that were received from the server.
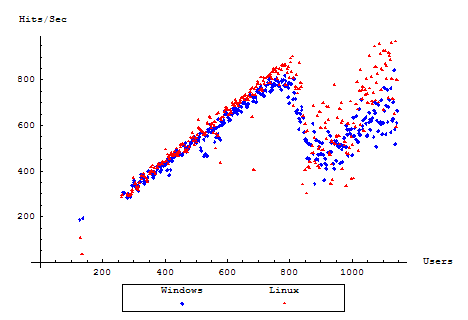
It seems here that even during the slump, despite error handling techniques, the rate of successful HTTP messages processed remains roughly on par between our servers, once again showing a very slight favoring towards our Linux installation.
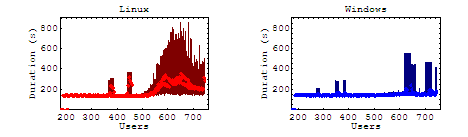
Duration
For our last performance aspect, we concern ourselves with how long is a user going to be taking in order to complete their task. We are measuring the full time until a response was received from a server, waiting until it has arrived before moving onto the next page of the test.
For the duration times for a business case, the baseline for each graph is defined as the amount of time the user spends "interacting" with the page before moving on to the next page. The simulated time spent by the user on the last page is therefore omitted.
The duration graphs here show the full range of measured durations during a given interval (dark background), with the averages on top (highlighted points).
Long Scenario
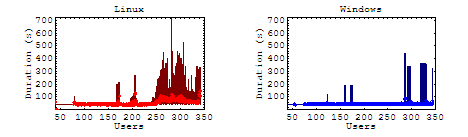
Medium Scenario
Short Scenario
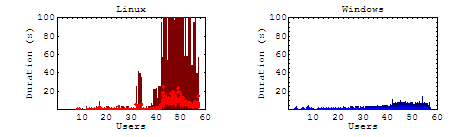
In our long case (where the user must navigate through the longest list of pages) the anomalies have had a nice chance to average out through one page or another. As expected, we see the results of our throughput slump by increased wait times from the server. For Linux, as the load approaches this turning point, the duration is seen to increase, but never fully recovers. For our other cases, the general trend remains the same with the affect on the average duration declining with shorter test cases.
Static & Dynamic Content
From these cases we see some relatively consistent increases in linux duration of each business case, but the question remains, were those increases attributed to the server being swamped by multiple requests, or were they simply getting hung by the dynamically generated portions of the page. Please note that since the maximum durations are significantly different, these graphs are scaled logarithmically.
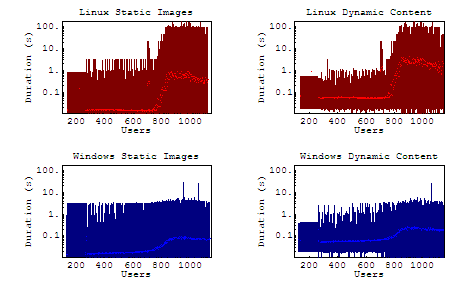
It is interesting to note here that there is a very slight but consistent increase in average durations for both servers, though more pronounced on our Linux server. Under load, the maximum duration for windows rarely peaks above 10 seconds, where Linux steadily maintains maximum durations over 100 seconds.
Analysis
Here, we've noted the behavioral and performance differences for each server up to, during, and after a bottleneck. Different bottlenecks will of course have key indicators as to their cause. However, from the end-user's point of view, many bottlenecks will end up being dealt with in the same way. Some preliminary testing was performed afterwards by tweaking the VM memory settings in order to remedy our performance slump, and verify that it was in fact a memory limit. However, we do see indicators that the VM must have been forced to block for otherwise background optimizations, as the performance for both servers did eventually recover. In the next part of this report, we will find that tuning the JVM memory parameters resolve the performance slump that we saw in this round of testing, confirming that the problem hit by this test was a memory limitation. Despite the specific cause of our slump, it is not inconceivable that other performance pitfalls will end up being dealt with in the same fashion.
Prior to reaching capacity, our Linux server showed it's ability to scale subtly better, notably with a higher completed response rate. This trend arises again after the servers have been able to recover from their performance slump.
When our servlet found itself hitting memory limits of the app server, the platforms had an opportunity to reveal different error handling techniques. Linux maintained it's lead over it's Windows counterpart, except when it was forced to deal with the memory shortage. Users were potentially forced to wait minutes or more for their page to complete loading. Potential waits turned into repeated waits for users navigating through a long sequence of pages. Windows users saw a different story. Under the same memory shortage, the OS was forced to turn away traffic, but delivered roughly the same number of successful hits as our Linux server.
Supplemental Materials
- Testcase and results (9.12 MB .wpt file (zipped)) for use with Web Performance Trainer load-testing tool.
- Source code for the servlet
- WAR file deployed to Tomcat
Feedback & Comments
Comments about this report may be posted at the company blog post.
Get web performance news
Occasional load-testing tips, performance-engineering notes, and product updates. No spam — unsubscribe anytime.