Load Testing SugarCRM in a Virtual Machine
Determining the CPU cost of virtualization with VMware ESX
Christopher L Merrill
©2008 Web Performance, Inc.
v1.1
Summary
The performance of our reference application under load (a default SugarCRM installation) on a virtualized server showed a 14% decrease, measured by total system capacity, compared to the same system running natively on equivalent hardware.
Overview
In a typical virtualization deployment scenario, a virtual machine replaces an existing physical machine. Multiple VMs will usually be deployed on a single host machine, sharing the resources of the host. For instance, VMs with a total of 16 cores might be deployed on a 4 core host machine. As long as utilization remains low, the processor resources can be shared while maintaining application performance goals. However, when the utililization of a single VM becomes very high, performance of one or all the VMs will suffer if the resource sharing continues. With the right hardware and software configurations in place, VMware ESX can dynamically re-assign the under-utililzed VMs to other processor cores or even move the VMs to other hosts. This allows the overloaded VM full use of the host resources (up to the limit of the assigned memory and processor cores). In this report, we measured the performance of the heavily-loaded VM under these conditions. The result is an answer to the question "when the virtualized server is fully loaded, how close will the performance be compared to the same system running natively on equivalent hardware"?
In a previous report, we measured the capacity of a free virtualization product, VMware Server. Thanks to the generosity of BlueLock, we had the opporitunity to test VMware ESX on enterprise-grade hardware in their state-of-the art facility. In this report we compare the performance of our reference application running on bare hardware to the same application running on a virtual machine hosted by ESX on equivalent hardware. The purpose is to determine the impact on CPU performance and estimate the cost in terms of total system capacity.
Our primary measure of performance is user capacity. We define that as the number of simultaneous users that the system can support while meeting the specified performance criteria. The performance critera for this test require that the average page duration for each page may not exceed 6 seconds and no errors are encountered in the application.
Caveats
This test does not attempt to simulate the performance of the virtualized server during the period prior to the decision to reallocate VMs. It evaluates the performance of the virtualized server when it requires maximum performance. Also, please note that this report is concerned with the performance of the system under load at maximum user capacity. It does not make any statements about the performance of an idle or lightly-loaded system. The purpose of the report is not to estimate the capacity of a SugarCRM system or make any predictions about expected performance. Every SugarCRM deployment will be different.
Special Thanks
As noted above, we could not have performed these tests without the assistance of BlueLock, who provided much of the required hardware, software and infrastructure. BlueLock serves its clients by providing the people, expertise and infrastructure in a world-class, SAS 70 certified data center. The company offers its technology services under an infrastructure-as-a-service (Iaas) model, which includes physical IT infrastructure (servers, routers, firewalls, switches and storage devices), 24/7/365 management, monitoring and support as well as integrated disaster recovery.
Methodology
To skip the methodology, you can jump straight to the analysis.
Software
The servers ran version 4.5.1e of SugarCRM installed via the standard installer (SugarOS-4.5.1e.zip). The OS on the servers was a standard server install of CentOS 5, minus some of the unused services and firewall. The load-testing software is Web Performance Load Tester 3.5.5447. The Web Performance Server Agent (same version) was installed on the server.
Hardware and Software configurations
The servers were configured to match the scenario described in the overview. The table below shows the configuration of the Physical Machine, the Virtual Machine and the Host Machine (on which the VM was hosted). Note that the specs for Physical Machine and Host Machine refer to real hardware while the Virtual Machine obviously refers to the virtual hardware emulated by VMware.
| Physical Machine | Virtual Machine | Host Machine | |
|---|---|---|---|
| Processor cores | 2 | 2 | 4 |
| Memory | 4G | 4G | 16G |
| Hyperthreading | disabled | disabled | disabled |
| Operating System | CentOS 5 | CentOS 5 | VMware ESX 3.0.2 |
The test servers ran on HP BL460C C-class blades with Intel Xeon 5130 dual core processors and 36G 10k RPM SAS drives. Three load-generating engines were used running on similar hardware to the servers. Each engine ran the Web Performance Instant Load Engine version 3.5.5275. For these tests, one load engine would have been sufficient, as evidenced by low CPU load during the tests.
The server blades, storage, and test equipment were connected to Cisco 3560G switches at 1000Mbps.
Test cases
The test cases selected for this load test mirror those selected for the SugarCRM Load Testing tutorial.
Please note that the user mix, think times etc. may or may not reflect your SugarCRM implementation. The rated user capacity of the system is not likely to reflect any specific real-world deployment. To a large extent, these choices are irrelevant to this test, since the goal is not to evaluate the performance of SugarCRM, but rather determine the impact of vitalization on before-and-after results.
The test data repository file is available for examination - the demo version of Load Tester can view the test cases, load configurations and detailed raw metrics. It cannot view the test reports, so they are provided as part of this report (see references).
Load Configuration
The Load Configuration was created with these parameters:
- Four test cases, as described above
- VUs (virtual users) are distributed among the test cases as described in the SugarCRM Load Testing tutorial.
- VUs use the recorded think times, which are typically ~2-6 seconds per page. Think times are larger for some pages pages, such as adding a contact or a note, or reading a note.
- Each VU is simulating a 5Mbps network connection (e.g. cable/DSL connection)
- The test starts with 20 users and adds 1 user every minute. VUs start at random intervals within each minute.
- 10 second sample period
The test parameters were determined after preliminary tests were used to approximate system capacity. Each test was terminated shortly after the system reached maximum capacity.
Database Management
The database was restored to an identical state prior to each test using the procedures outlined in the SugarCRM Load Testing tutorial.
Test Procedure
Each test run followed these steps:
- Restore database to pre-configured state with 100 users and 250 accounts, 1000 contacts and 3000 notes.
- Restart the server
- Start the server monitoring agent
- Run warm-up test (25 users running the View Note test case for 3 minutes)
- Run the load test
For the physical and virtual tests, 3 runs were completed under each configuration. The best run of the 3 was selected as representative of the configuration. However, the results of the 3 showed minimal differences. For completeness, they are included in the test results file.
Analysis
User Capacity
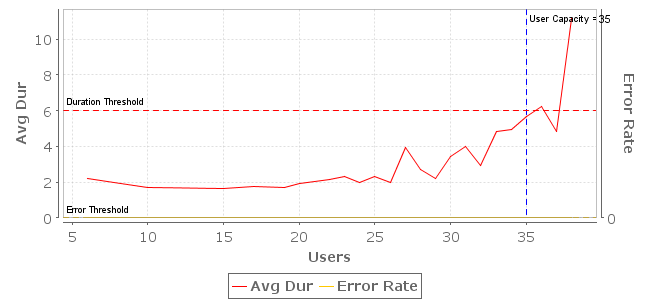
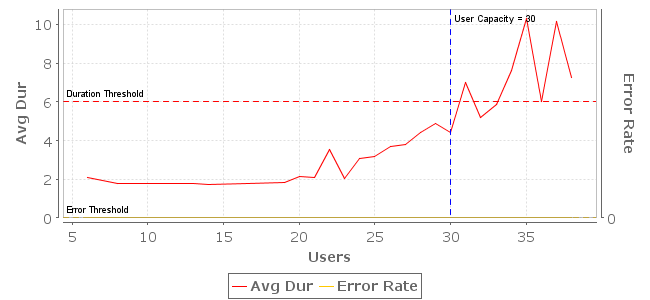
Our analysis shows the capacity of the physical machine was 35 users. The virtual machine had a capacity of 30 users - a decrease of 14% from the baseline capacity. This analysis, along with a variety of charts is produced automatically in Load Tester's Load Test Report. Consult the User Capacity section of the test reports for more details on this analysis (see references). The charts shown below are extracted from that report section. The red line on the chart depicts the maximum of each average page duration as measured during each sample period. The location where that line crosses the duration threshold indicates the point where performance no longer met the criteria. Had any errors occurred during the test, the yellow line would depict the error rate and indicate when it crossed the error threshold.
Physical Machine User Capacity analysis
Virtual Machine User Capacity analysis
Page Duration
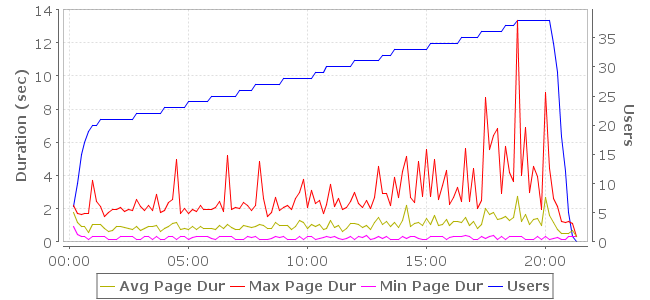
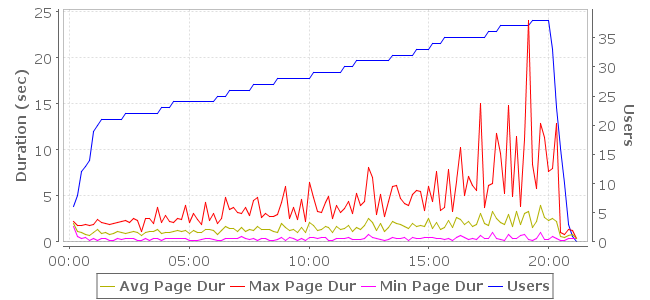
To confirm the findings from the User Capacity analysis, we next look to the Page Duration charts. These show the minimum, maximum and average page durations during the test. These charts are from the Summary section of the load test reports. Note that the virtual machine test experienced one maximum duration significantly higher than the test of the physical machine, resulting in a different scales on the two charts. Note that the gold line depicts average duration of all pages sampled during a sample period, but the user capacity calculation is based on the maximum of all the average page durations in a sample period. This why the average page duration never exceeds 4 seconds on these charts, but does in the above analysis.
Physical Machine page durations
Virtual Machine page durations
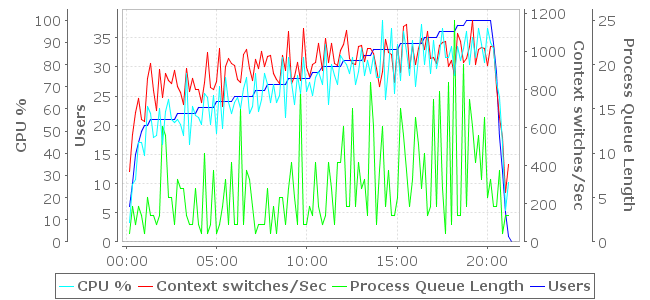
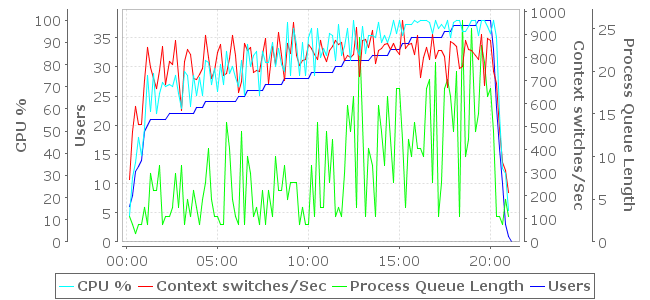
Server processor utilization
As expected, the limiting factor in the application performance is processor utilization. The charts below (extracted from the Servers section of the load test reports) show several processor-related measurements that were collected during the test using the Advanced Server Analysis module. The light-blue plot depicts the CPU utilization (%). In both tests, the CPU is nearing 100% utilization when the page duration were reached. It is apparent that the virtual machine reaches CPU shortly after the maximum capacity was reached, while the physical machine had not yet reached CPU saturation within the parameters of this test.
Physical Machine processor measurements
Virtual Machine processor measurements
Conclusion
Under the conditions tested, the reference application (SugarCRM) showed a 14% decrease in total user capacity when running in a virtual machine (decreasing from 35 users to 30).
At the peak capacity of the virtual machine (30 users), the average page duration was 1.57 seconds, whereas the average page duration of the physical machine at the same load level was 0.97 seconds. Compared at that level, the average page duration for the virtual machine increased 61% over the same load on the physical machine.
Since most applications only run occasionally at full capacity, it is worth also analyzing the performance of the system at a lower level of load. At 21 users (60% of the full capacity of the physical machine, 70% of virtualized capacity), the average page duration was 0.84 seconds for the physical machine and 1.00 seconds for the virtual machine - an increase of only 19%. For our reference application, this difference (0.16 seconds) is unlikely to be noticed by the average user.
Reference Materials
- complete load test report for physical machine test
- complete load test report for virtual machine test
- Load Tester repository file (to be used with Web Performance Load Tester for further data analysis)
Feedback & Comments
Comments about this report may be posted at the company blog post.
Version History
v1.0 - 1st public release (15 Jan 2008)
v1.1 - email cleanup (23 Jan 09)
Get web performance news
Occasional load-testing tips, performance-engineering notes, and product updates. No spam — unsubscribe anytime.