Safari 3 Windows Performance Analysis
Evaluating Apple's Browser Performance Claims in The Real World
Michael Czeiszperger
©2007 Web Performance Inc, October, 2007; v1.2
Introduction
On June 11th, Apple released a Windows beta version of its OSX web browser, Safari 3.0, claiming its the "fastest browser on Windows". The claims were based on the results Apple found while running the iBench benchmark from Ziff Davis, with separate measurements for HTML, JavaScript performance, and application start time. While benchmarks are invaluable for performance evaluation, we set out to see if those claims would make a difference in actual browser usage.
Designing The Test
Other tests have run Safari 3.0 Windows beta through benchmarks and shown how it performs with canned tests, but we are more interested in seeing how the browsers perform when people are actually using them. This meant measuring how Safari performed when actually browsing web sites, which creates several test design challenges when compared to an actual repeatable benchmark.
Which Web sites?
A recent test of Safari 3.0 involving only GMail and Google Maps showed Safari to be slower than Firefox 2 and IE7 on Windows, but tests of only two web sites can't possible by representative of the general user experience. Obviously more web sites should be tested, but which ones? This problem was addressed by picking the top sixteen english language web sites according to Alexa traffic ratings as of 8/29/2007. This approach resulted in a variety of site designs being tested, from simple static pages to complicated DHTML designs which represent a good cross section of the typical user's browser experience. Testing more web sites may have increased the accuracy, but sixteen was chosen as a good representative sample that could be easily tested, and covered a variety of popular sites at the same time.
- yahoo.com
- msn.com
- google.com
- youtube.com
- live.com
- myspace.com
- orkut.com
- wikipedia.org
- facebook.com
- hi5.com
- rapidshare.com
- blogger.com
- medaupload.com
- microsoft.com
- friendster.com
- fotolog.net
Network Effects
A major challenge in testing a browser's performance directly is bandwidth. It can vary wildly, and its impossible to definitively know whether a site's performance is slow because the network is congested or the server is loaded rather than anything having to do with the browser. This problem can be somewhat minimized by taking multiple measurements at different times of the day, but still doesn't meet standards of repeatability.The server could be lightly loaded when testing one browser, and then suddenly congested when testing another.
This problem was tackled by doing separate tests on live and canned web sites. The live measurements were taken against the actual sites at a variety of times and the performance numbers for each site averaged.
The "canned" performance was created by saving the web site's HTML to a local server, and measuring the performance of the browser over a LAN. To make this scenario more typical a network bandwidth limiter was used so that the browsers accessed the local versions of the web site's at a high-end speed of 5 Mbit/s. Thus we had two separate techniques for measurement, which if they were accurate, should be fairly similar after compensation for the decreased bandwidth available to the live tests. In other words, the differences in browser performance should be very similar in both groups.
Note that we emphatically make no claims about the superiority of this approach over any other. It has clear limitations, and should be taken only has one of many data points in the overall browser performance picture.
Measurement Technique
Measurement of web page performance was done using our own Web Performance Load Tester, which analyzes HTTP traffic. Another tester identified an issue when using javascript to measure web page load time, a problem which is avoided in our approach. The reason this measurement technique is reasonably accurate is that in an attempt to improve rendering speed, the browser's pre-render the pages as much as possible, while simultaneously pipelining HTTP image requests on multiple threads. By the time the last byte of the last image arrives, the web page is entirely rendered except for the last image, for which the render time is negligible.
This technique does have its challenges, AJAX web page designs, for example, as the asynchronous background HTTP traffic can be confusing to decode. Luckily, the software groups HTTP traffic that happens after the initial load separately, so it was fairly easy to identify the main page and its associated statistics.
Caching Effects
When measuring web page performance there are two scenarios. The first is when the user is accessing a web page for the first time; the second is when accessing a web page for which a significant portion of the resources are cached. Both scenarios were tested separately to determine if there were any differences.
Realistic Usage
In an attempt to measure realistic usage the sites were accessed as you would expect in normal usage, which means not testing the "sign up" page you'd get as a new user, but rather the site in actual usage. For example, when testing Wikipedia, a typical content page was used, and not the default page you get when accessing wikipedia.org which allows the user to select a region.
Setup
The operating system used was Windows XP Professional SP 2. The web server used was IIS 5.0 with HTTP connection reuse and compression turned on. Browsers tested include Firefox 2.0.0.6, Safari 3.0.3, and Internet Explorer 7.0.5730.
Limitations
The limitations of this test is that it does not look at the performance of a very complicated AJAX site such as GMail, as that comparison has already been made, and would have greatly increased the complication of the tests. As such, this test is intended to do a good job of measuring overall HTML rendering, but probably not is a good indicator of heavily interactive sites in the same class as GMail.
Another limitation is the sites to be tested were limited to those hosted in the US. This was primarily done because sites hosted in Asia increase the likelihood of random network performance effecting the data, tend to be more complicated in general, and use a different character set. The results of the live test in particular would have been rendered suspect.
Finally, the technique of recreating a web site locally only works perfectly for simple web sites. The more complicated a web site, the less likely it is that it can be recreated by a 3rd party. This does, however, fit in with the other limitations of the test.
Test Data
Locally Hosted Measurements
The web sites listed above were hosted on a local IIS web server, and both initial and cached measurements taken. It quickly became apparently that one browser was not the fastest overall. One browser would be fastest on one web site, while another might be the fastest on another.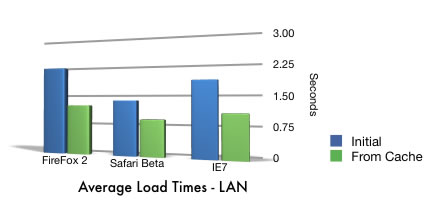
The load times were averaged, giving a general idea of performance across a spectrum of sites. The chart above shows the Safari 3 beta to be the fastest, followed by Internet Explorer 7, followed by Firefox 2 as the slowest. The performance results when accessing a previously rendered web page were faster than the initial load, and generally followed the same relationship as the initial load, with the Safari beta again being the fastest, followed by IE7 and then Firefox 2.
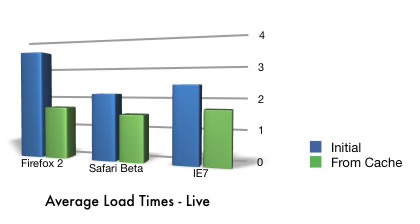
Live Measurements
The web sites were again accessed, but this time the original web servers were accessed directly. In this test the overall relationship between the browsers has been maintained, but the average load times has increased, reflecting the increased hit of restricted bandwidth on performance.
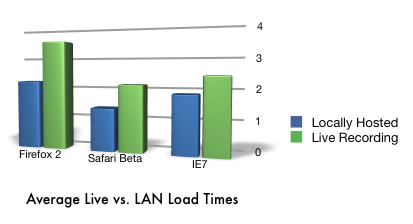
If the LAN-based tests were accurate, averaging the web sites live performance should be consistent with the previous measurements, and this turned out to be the case. The chart below shows a comparison of average initial web page load times between the LAN and live measurements. As you can see, the overall relationship between browser performance is maintained for the initial web page load, with the Safari 3.0 beta the fastest, followed by IE7 close behind, and Firefox 2 the slowest. The performance from cache has changed, with Firefox 2 and IE7 in a virtual tie, but both being beaten slightly by the Safari 3 beta.
Analysis
Which Browser is Fastest?
In all cases the Safari 3 Windows beta was the fastest browser in terms of web page load time. The differences between average web page load time for all of the tests are summarized in this chart:
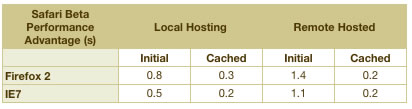
The performance gains on the average remotely hosted web page varied from .2 seconds when from cache and up to 1.4 seconds when loading a web page for the first time. The .2 second difference between Safari beta and Firefox 2, and Safari beta and IE7 is negligible, and shows that for web sites that are accessed frequently, and thus likely to be in a browser's cache, we found no appreciable difference in performance.
The average initial web page load time was a different story, with Safari 3 beta showing improvements of between 1.1 and 1.4 seconds when accessing a live server over a cable modem. The importance of this difference is certainly up to the individual, but over a typical "high speed" internet connection this performance increase is likely to be noticeable.
The locally hosted web page load times still showed Safari 3 as being the fastest, but the differences were much smaller, as one would expect without network effects. The average performance from cache was practically the same whether accessing the web site from a local LAN or over the internet, which is the expected result.
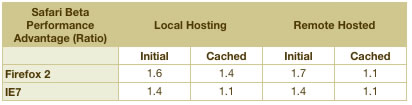
Data Consistency
The point of repeating the tests with web sites hosted on a local LAN was to make sure that the figures collected from the actual web sites weren't corrupted by changing network performance of server load. The table below shows how the performance ratios between the Safari load times and its competitors remained virtual constant between the two tests, indicating that the live, remote load times are most likely to be accurate.
Evaluating Apple's Performance Claims
The exact claim from Apple is "...Safari loads pages up to 2 times faster than Internet Explorer 7 and up to 1.6 times faster than Firefox 2." Assuming that Apple would pick the most advantageous numbers, we assume they would ignore results from cache, and so we'll look only at the initial load times.
For Firefox 2, Apple claimed a performance advantage "up to 1.6 times faster", and then showed a graph with an average load time of 2.14s for Safari 2 and 3.67 for Firefox 2. The ratio of those two numbers is 1.7, which closely matches our result.
For IE7, Apple claimed a performance advantage "up to 2 times" faster, and showed a graph with a "HTML Performance" ratio of 2.2. The actual performance ratio we found was 1.4, which is not quite the claimed improvement, but is still measurable faster.
The degree to which Apple's claims have been substantiated depends on whether you would like to hold them to the exact numbers, or to the general concept that there is a meaningful performance advantage for Safari 3. That Safari 3 has superior performance to Firefox 2 and IE7 was confirmed in the case of initial web page load time, and barely the case when loading pages from cache. The actual browser performance one would experience still varies depending on the particular web site you visit.
Feedback&Comments
Comments about this report may be posted at the company blog post.
Version
History
v1.0 - 1st public release (20 oct 2007)
v1.1 - fixed typos (24 oct 2007)
v1.2 - email cleanup 23 Jan 09)
Get web performance news
Occasional load-testing tips, performance-engineering notes, and product updates. No spam — unsubscribe anytime.