Configuring and Analyzing Performance Goals
One of the most important features of Load Tester is the depth of the analysis. A Load Test report contains sections that summarize the performance of your system at a high level, as well as sections that dive deeply into the details of each page and transaction.
This tutorial will show you how you can use performance goals to customize the reports to give you information that is relevant to the individual performance requirements of your system. The goal is to help you learn to draw better conclusions from the data and get more accurate results. You’ll also spend less time poring through the data.
This tutorial assumes that you have some knowledge of Load Tester, including navigating through the user interface and running load tests. See this video for a good introduction to Load Tester.
Examining a Load Test Report
We’ll begin by examining a load-test report, inspecting some tables and several charts. We’ll see how the performance goals are reflected on the charts, and examine some other areas of the report. Then we’ll work backwards, reconfiguring the performance goals, and observe their effect in the reports.
Examining Page Duration Goals
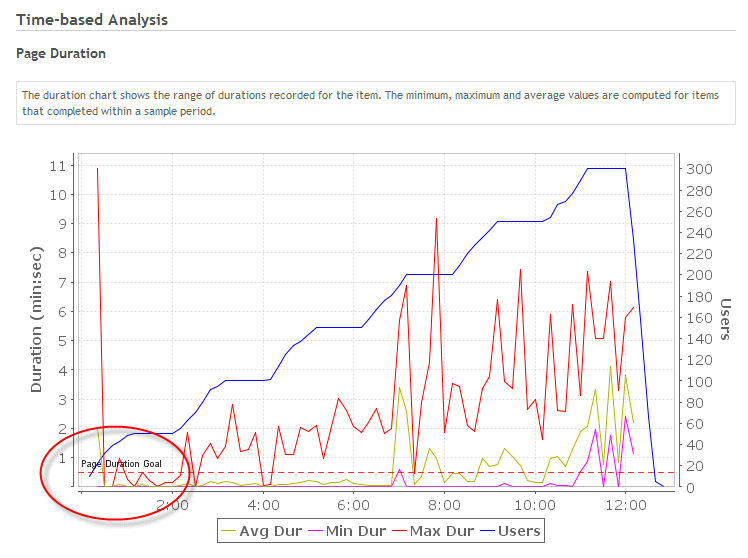
The chart below shows a page-duration goal of one second, and provides a good indication of how the pages in the test performed in comparison with the performance goal.
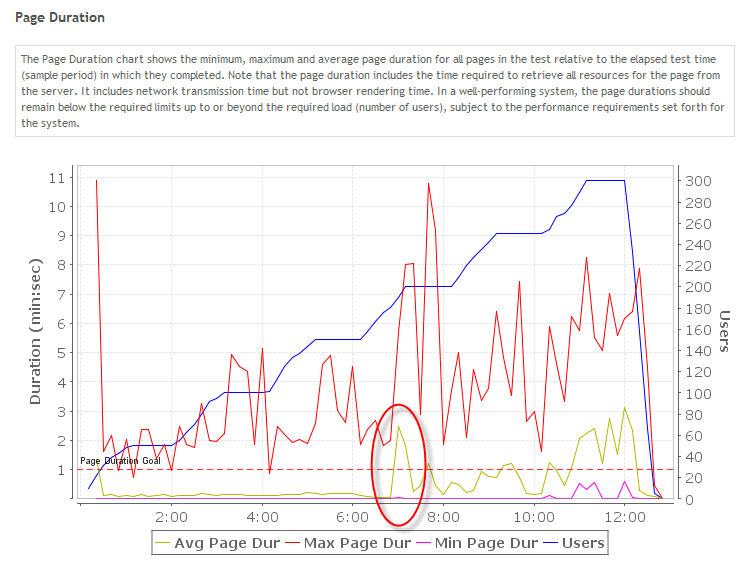
The maximum page duration exceeded the goal right from the start, and around the seven-minute mark the average page duration exceeded the performance goal.
The page-duration goals are shown on every chart related to page duration, including detailed page durations and average wait time.
Examining the Failures Chart
The failures chart shows the percentage of pages that failed throughout the entire test, all pages in all test cases. The page failure rate goal is defined globally for the test, and is analyzed globally by default.
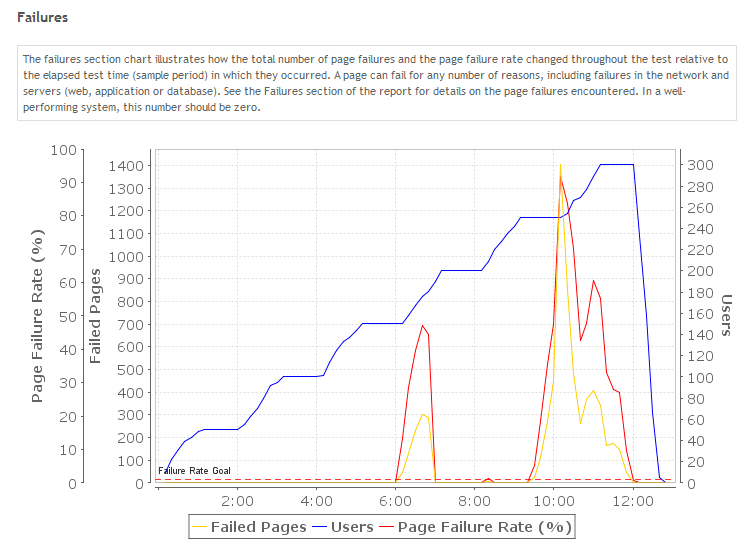
You can see here that our failure rate goal is somewhere around zero percent, and you can see that our page failure rate has exceeded that goal by quite a bit around the six minute mark.
The failure rate performance goal is also configured at a global level for our load tests, so let’s take a look at how that is done.
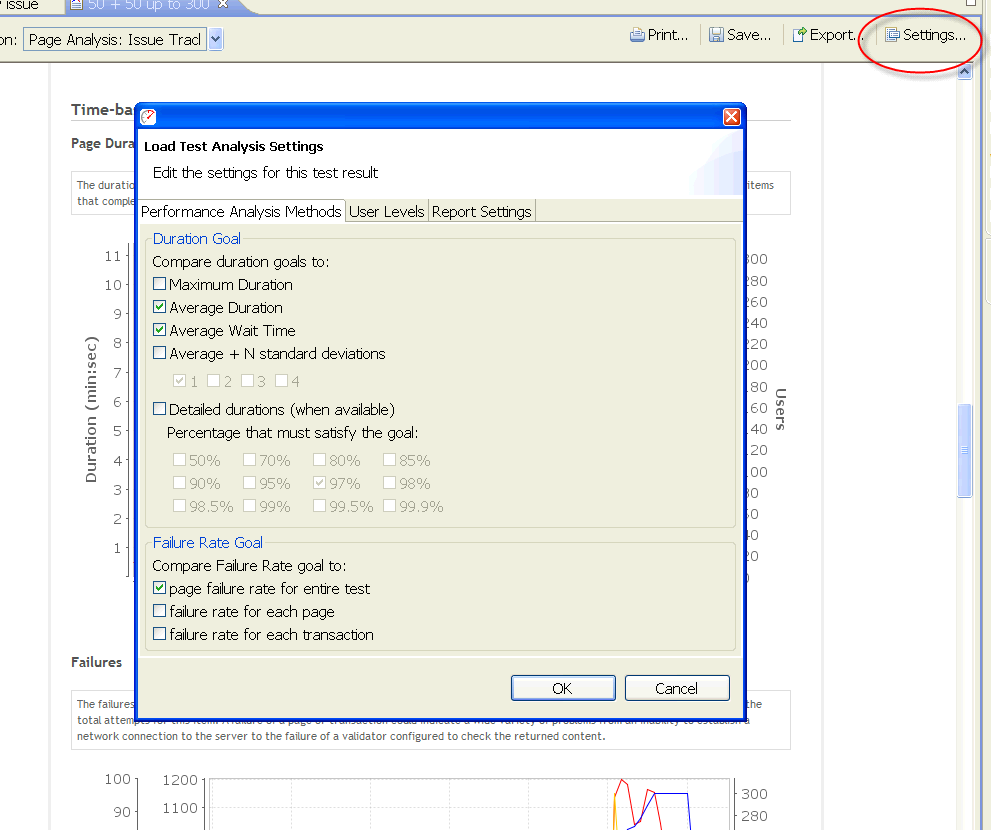
Setting a Failure Rate Goal
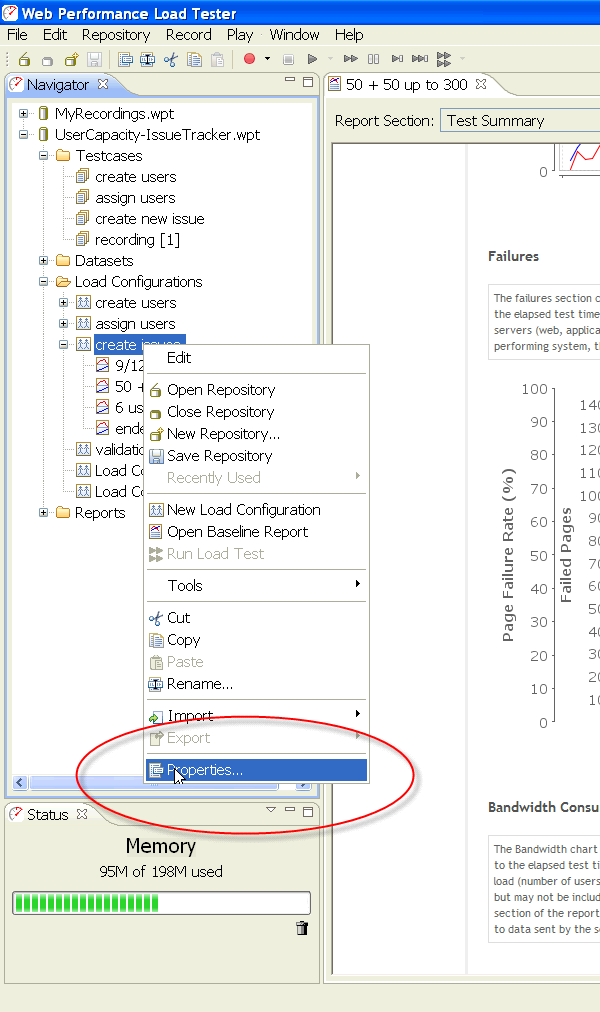
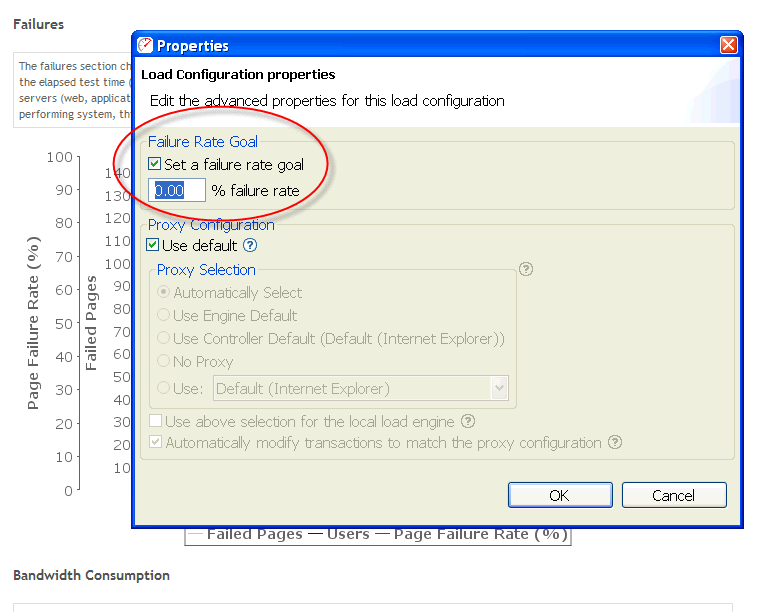
The two screens below show how to set a failure rate goal in the load configuration properties. Here it was set to zero percent, and if we wanted to change that goal, we would do so here.
Performance of a Specific Page
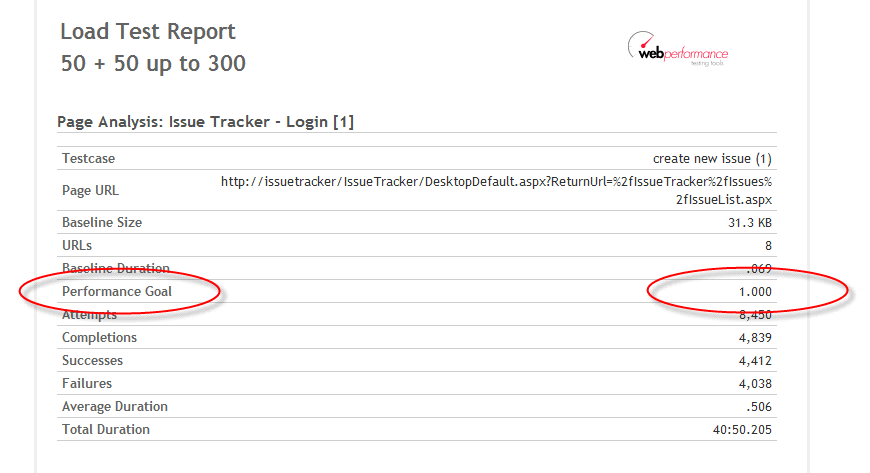
Next, we’re going to take a look at the performance of one specific page. We’re going to do that by navigating, in our report, down into the first page of one of our test cases.
One of the things we see here is that our performance goal for this page is listed in the Page Analysis table at the top of the report.
Next we’ll scroll down to the page duration chart. You can see here again our page duration goal is one second, and that this page exceeded that goal somewhere around the seven-minute mark.
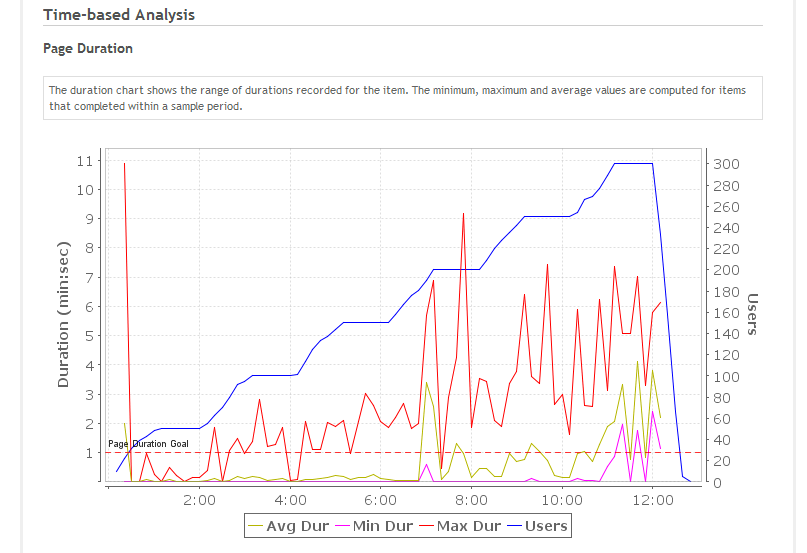
We looked at the failure rate goal and how it was configured, which was at test level. In contrast, the page duration goals are more granular, being configured at the test-case level.
Setting Goals for Pages and for Individual Transactions
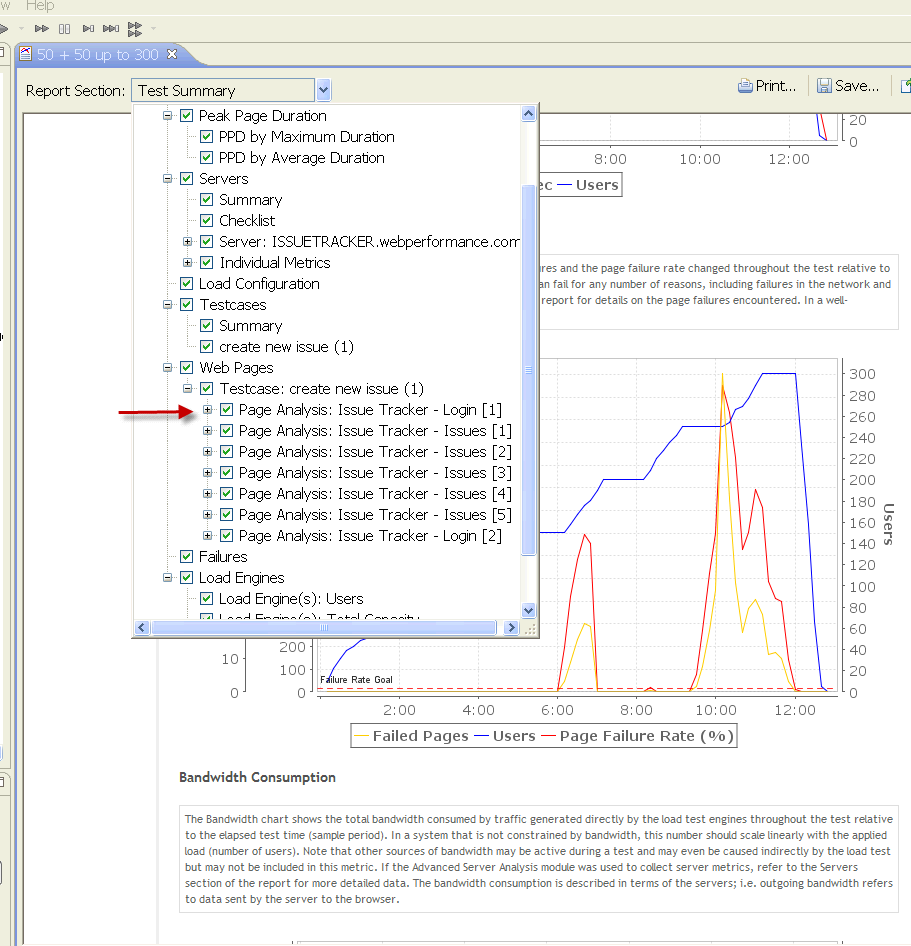
Let’s use the test-case editor to look at the test case that this page resides in. We double-click on create new issue in the Navigator and then right-click create new issue and click on properties to bring up the test case editor. As you can see here, the goal column shows the goal that’s configured for each page in the test case.
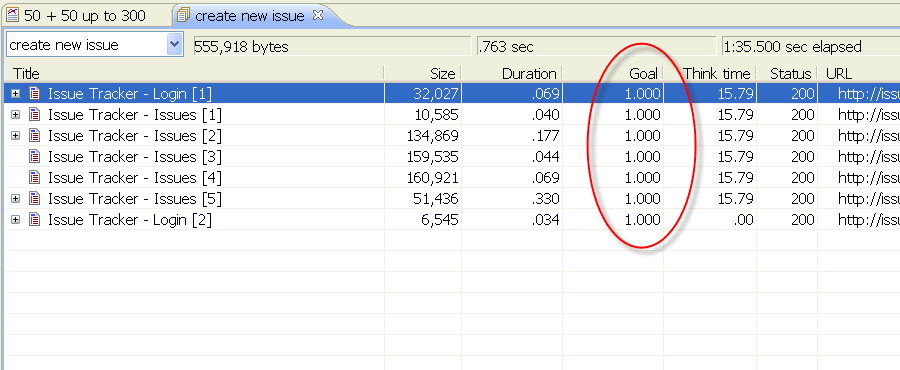
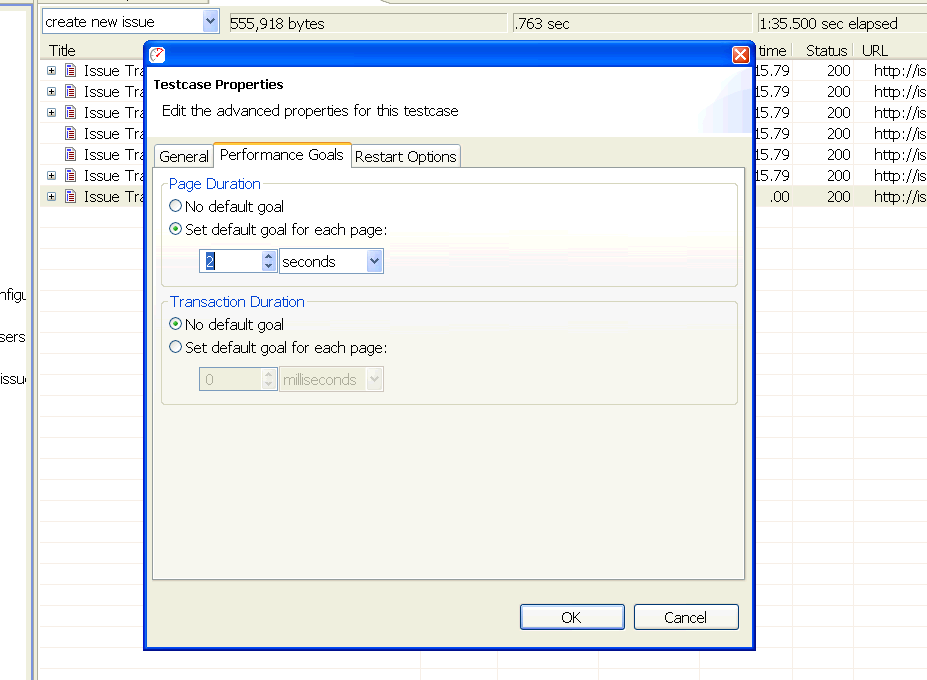
You can set the duration goal for pages and for individual transactions, either in the test-case level, that is, it would apply to all pages or transactions in the test case, or else you can customize duration goals for each page. For example, looking at test-case properties, we can see that we can set a goal for each page, or choose no default goal. We can also do the same for a transaction. Let’s change the default page-duration goal for each page in this test case to two seconds.
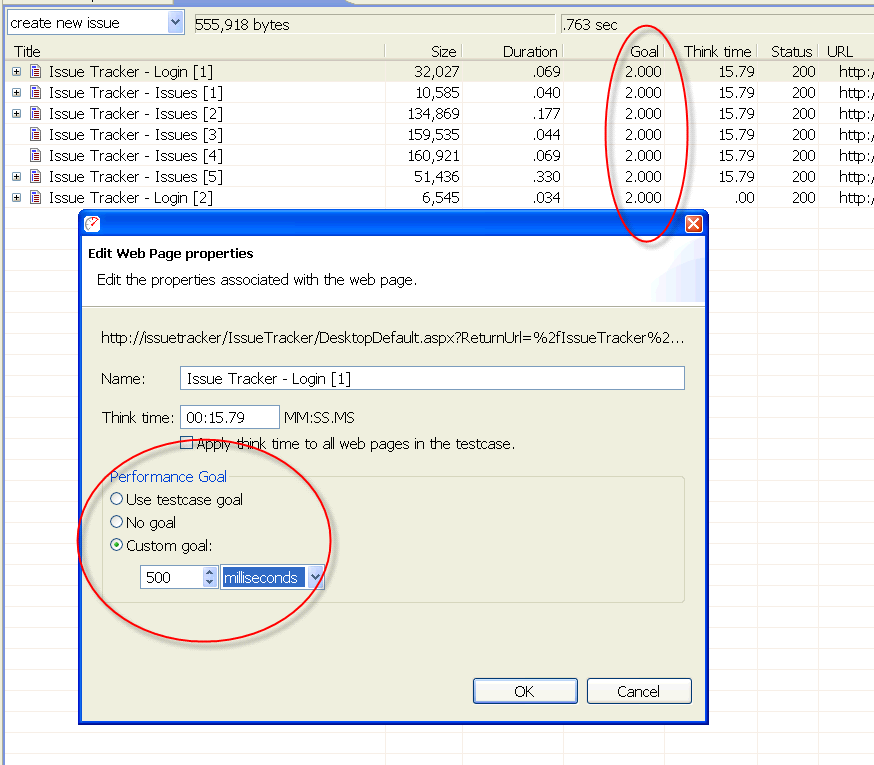
We can see, in the background of the screen below, that the goal has been changed in our test case for each of the pages. In the foreground of that screen, we’re about to override the goal for a specific page. We’ve selected the properties for that page and we want to specify a custom goal of half a second. So we select 500 milliseconds as the goal for this particular page.
Setting System Default Goals
You can also set default goals at the system level. If you go to Window>Preferences and then to Web Performance>Performance Goal Defaults, you can select default goals for new test cases and new load configurations.
Changing Performance Goals After Testing
One of the best features of the performance goals is that you can change any of them after the test is run. Suppose that after you have your test results, you receive some additional data about a requirement. You can change the goals and the report will accurately reflect those changes. You must remember to regenerate the report after changing the goals. You do that simply by closing the report and re-opening it.
After regenerating the report we’ll visit the page-duration chart again, where we can see that the page-duration goal for this page is now shown as half a second.
Everything you’ve seen so far about the page-duration goals applies to individual transactions as well. That includes the actions of setting the goals, customizing them for individual pages, and setting their defaults at the test-case level. All these customizations can be done for transactions, even to the extent of creating a separate goal for each transaction if needed. The section of the report for transactions has the same charts on it, and the duration goal is reflected on the charts in the same way as what we have already seen here.
Thus far we have examined configuration of page-duration goals, transaction-duration goals and page-failure-rate goals, and have seen how they are presented in the charts that appear in the load test report.
Using Performance Goals to Analyze Performance
At this point we know how to set goals, and how to see when they’ve been exceeded, whether looking at a specific page or the roll-up of all the pages at the highest level of the report. But what does this do for us?
The real value of performance goals is the way in which Load Tester uses the goals that you’ve provided, in analyzing the performance of your site and the way that it rolls up the analysis into higher-level results that you can use to quickly make decisions about the performance of your system.
Checking Performance Goal Compliance at Each User Level
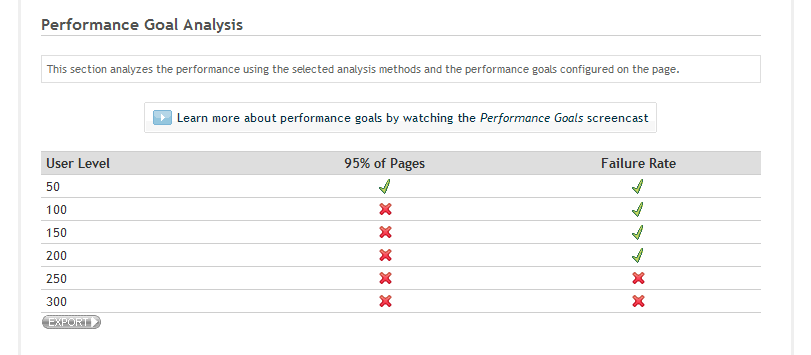
Let’s examine the performance goal analysis section for the page currently under scrutiny.
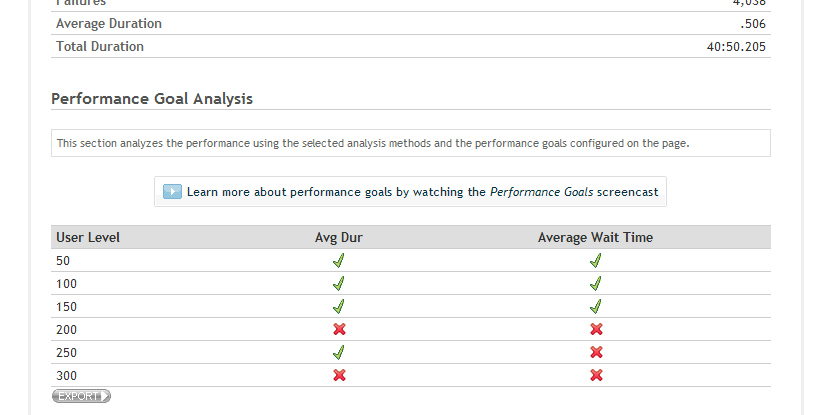
What we see here is a table which gives us a very quick understanding of how this page fared against its performance goals at various user levels. The gathered during the test can be summarized by user level. You might like to see our User Level Analysis video that explains analysis by user level.
What we see here is that at 50, 100 and 150 users this page passed its performance goals when measured against the average duration and the average wait time. At 200 users it failed. In this example the performance goals have been analyzed using two methods. They’ve been compared to the average duration and the average wait time.
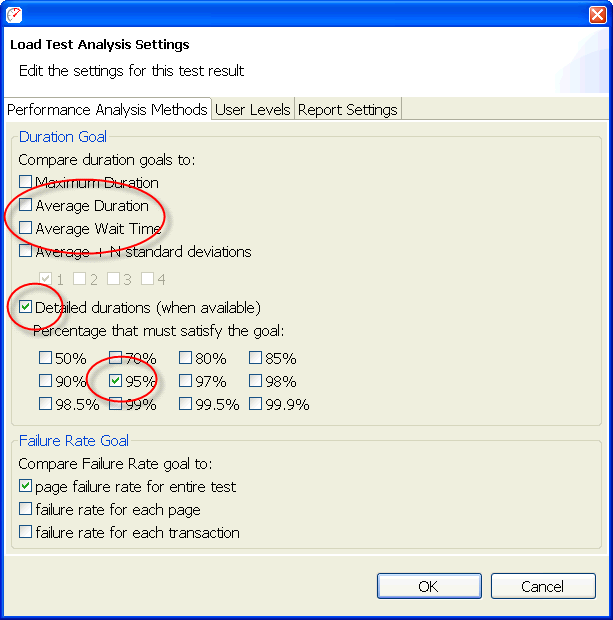
Changing the Analysis Methods
By using the Report Settings dialog you can change the analysis methods that the Load Tester uses. A number of different analysis methods are available for comparing the page against its performance goals.
Let’s tighten up our performance criteria for this page. Instead of judging it by average duration and average wait time, we’ll use detailed durations instead, since we have them available. We’re going to require that 95% of our pages must meet that performance goal.
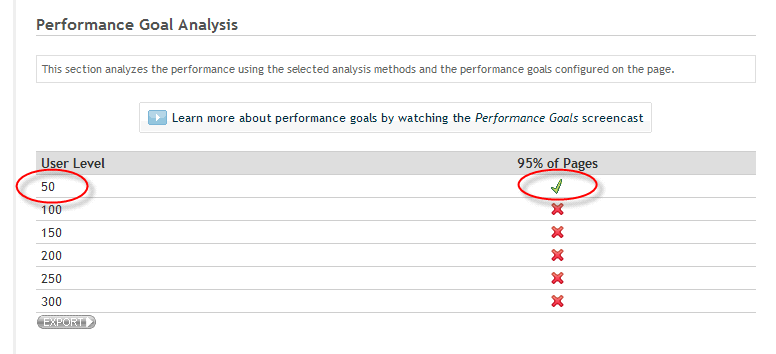
Now after reanalyzing with our new performance criteria, we can see that this page now only meets its performance goals at 50 users.
Applying the Page Failure Rate Goal to Individual Pages
We previously examined the page failure rate goal, which was configured at the load test level. We can also apply it to individual pages if we’d like.
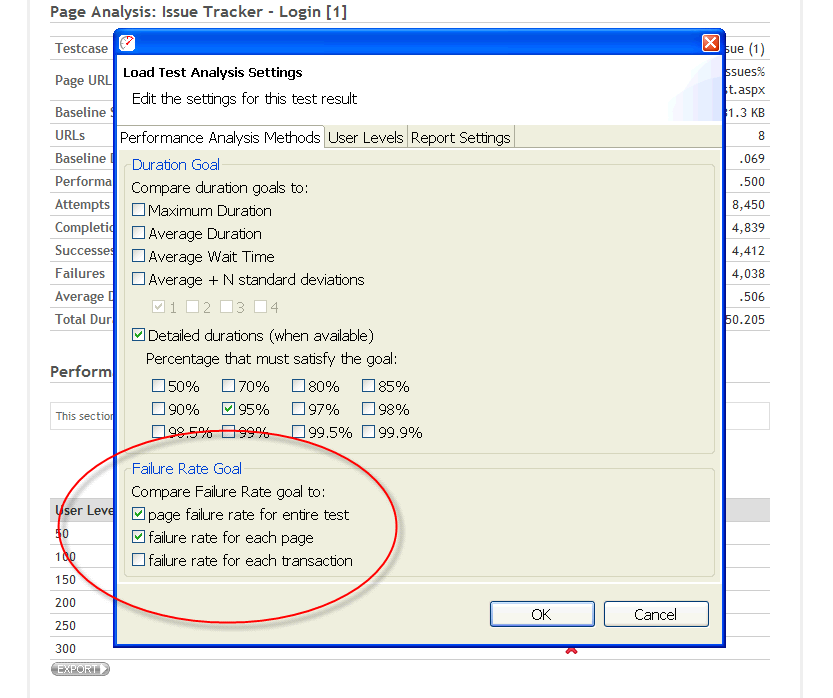
Returning to our report settings, we choose to apply our failure rate goal to the failure rate for each page. With the data reanalyzed, we can observe how well this page fares against its failure rate goal, as well.
So far we’ve seen how to configure performance goals and we’ve seen how to select analysis methods, the methods for judging a page’s transactions in our test against the performance goals. We’ve also seen how the report reflects the result of that analysis, and this is very handy if we’re looking at the performance of a specific page. It would be a bit cumbersome to have to go through every page to see how they all did.
Examining the Performance Goals Section
Now let’s look at the Performance Goals section of the report.
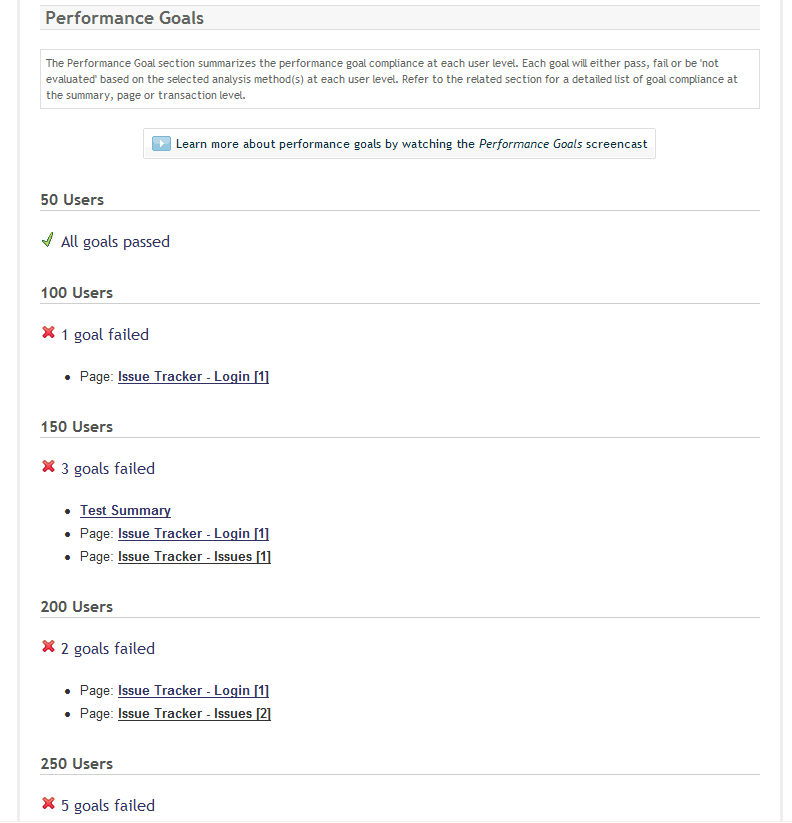
This section rolls up the results of all the items that were evaluated against performance goals. This rolled-up section makes it very easy to see where things passed and where they failed, quickly identifing areas of poor performance.
Based on the analysis that Load Tester did with our chosen methods, we passed at 50 users, and we failed at 100, at 150, and at 200. We can also see that at 100 users, for instance, one goal failed, and we see the list of everything that failed. As you can see, this is a link to the section of the report that is specific to that page, and that’s where we would go next if we wanted to see exactly why that page failed. That page is indeed the page we were just looking at, where we saw exactly which goals failed at each level and where we could see, among other things, the detailed charts for that page. The Performance Goals section thus makes it easy to see which items failed their performance goals, and at what levels they failed. It also gives us a pretty good feeling for how many things failed, and in this report shows us that as we apply more load, more items fail their performance goals.
Examining the User Capacity Section
So now we’ve seen how the Performance Goals section of the report can quickly point us at the problem spots in our application. But Load Tester takes this performance goal information one step further, providing us a User Capacity Analysis.
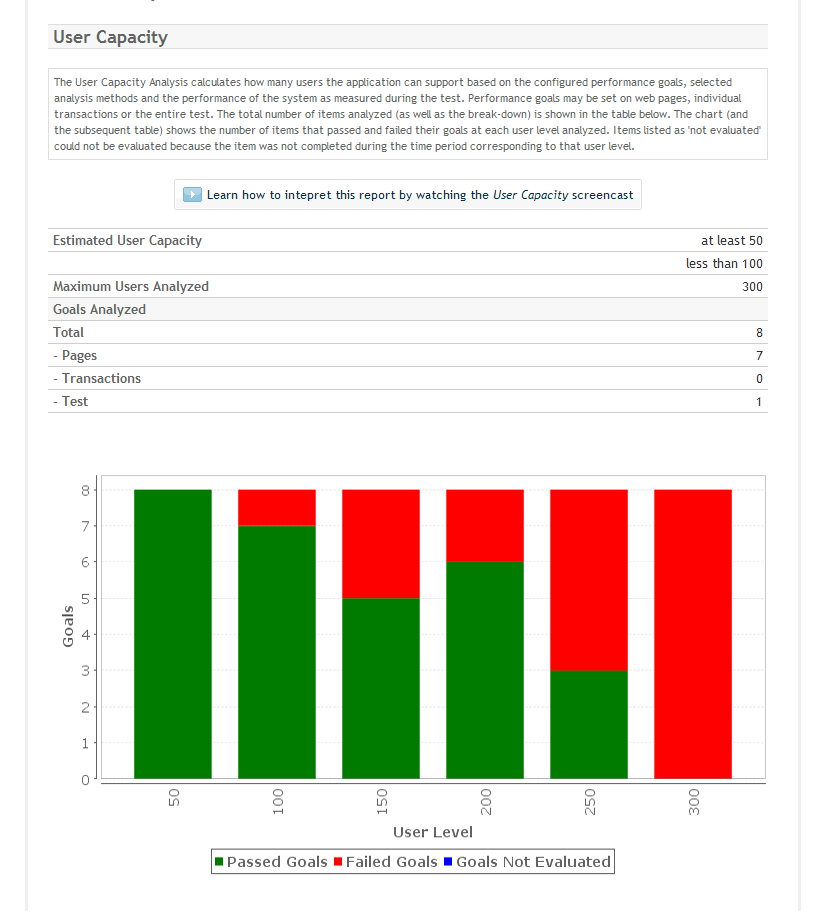
The User Capacity section of the report rolls up all that data we’ve analyzed about how everything in our system performed against its configured performance goals, and turns that into an easy-to-understand chart and a specific estimate for our user capacity. For further information about User Capacity, see our User Capacity video that explains how it works and how to interpret the data.
When his dad brought home a Commodore PET computer, Chris was drawn into computers. 7 years later, after finishing his degree in Computer and Electrical Engineering at Purdue University, he found himself writing software for industrial control systems. His first foray into testing software resulted in an innovative control system for testing lubricants in automotive engines. The Internet grabbed his attention and he became one of the first Sun Certified Java Developers. His focus then locked on performance testing of websites. As Chief Engineer for Web Performance since 2001, Chris now spends his time turning real-world testing challenges into new features for the Load Tester product.