| Load Test Report | |
| 50 + 50 up to 300 |
Executive Summary
User Capacity
The User Capacity Analysis calculates how many users the application can support based on the configured performance goals. See the User Capacity section for a more detailed analysis.
| Estimated User Capacity | at least 100 |
| less than 150 | |
| Maximum Users Analyzed | 300 |
Performance Goals
| 50 Users |
 All goals passed All goals passed
|
| 100 Users |
All goals passed
|
| 150 Users |
 1 goal failed 1 goal failed
|
| 200 Users |
1 goal failed
|
| 250 Users |
1 goal failed
|
| 300 Users |
6 goals failed
|
Slowest Pages
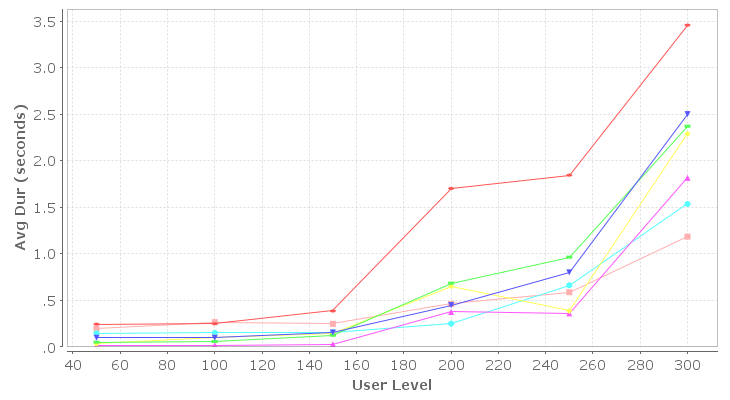
The chart belows show the slowest pages, as determined by the page durations measured during the test. See the Slowest Pages section for a more detailed analysis.
Top-level Metrics
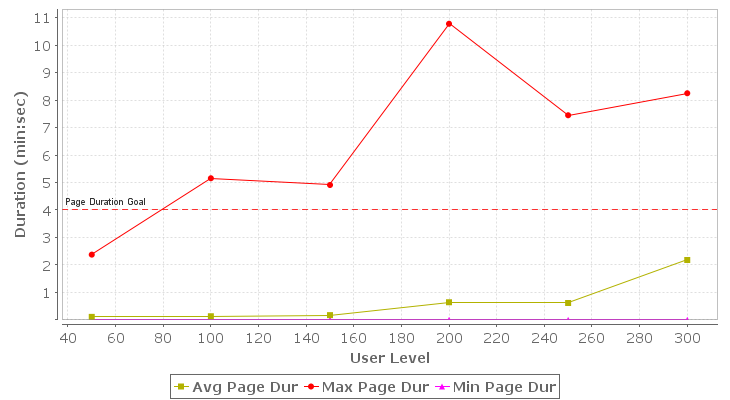
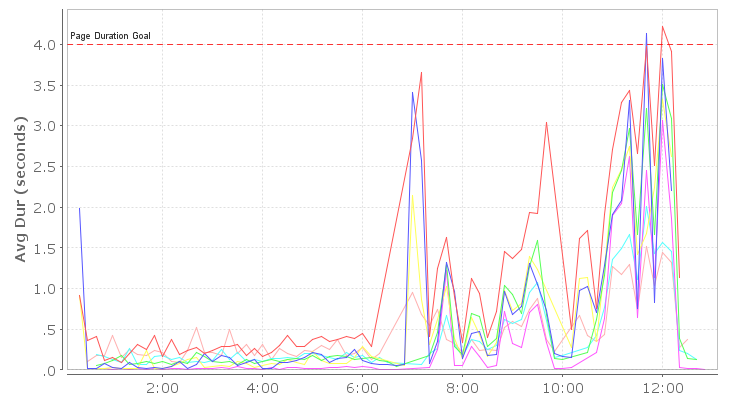
Page Duration
The Page Duration chart shows the minimum, maximum and average page duration for all pages in the test that completed during the sample periods summarized for each user level. Note that the page duration includes the time required to retrieve all resources for the page from the server. It includes network transmission time but not browser rendering time. In a well-performing system, the page durations should remain below the required limits up to or beyond the required load (number of users), subject to the performance requirements set forth for the system.
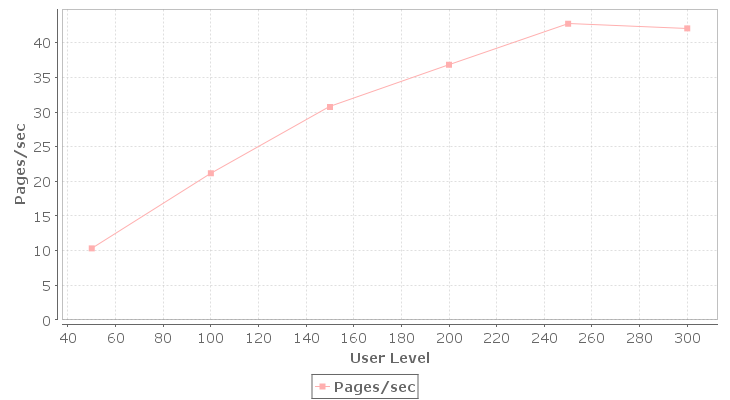
Page Completion Rate
The Page Completion Rate chart shows the total number of pages completed per second during the sample periods summarized for each user level. In a well-performing system, this number should scale linearly with the applied load (number of users).
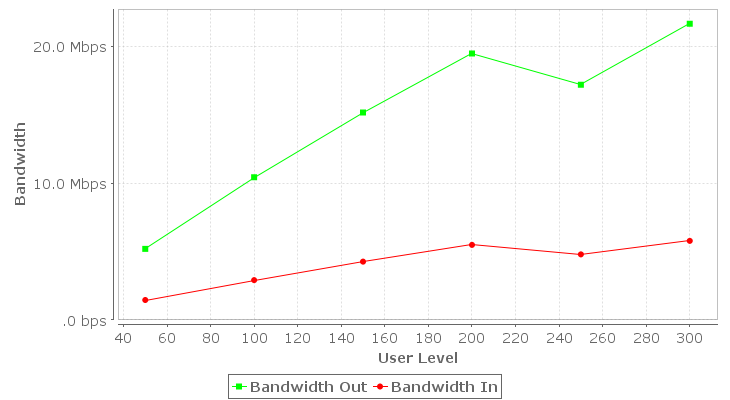
Bandwidth Consumption
The Bandwidth chart shows the total bandwidth consumed by traffic generated directly by the load test engines during the sample periods summarized for each user level. In a system that is not constrained by bandwidth, this number should scale linearly with the applied load (number of users). Note that other sources of bandwidth may be active during a test and may even be caused indirectly by the load test but may not be included in this metric. If the Advanced Server Analysis module was used to collect server metrics, refer to the Servers section of the report for more detailed data. The bandwidth consumption is described in terms of the servers; i.e. outgoing bandwidth refers to data sent by the server to the browser.
Learn more about the diagnosing bandwidth limitations by watching the Bandwidth screencast
Failures
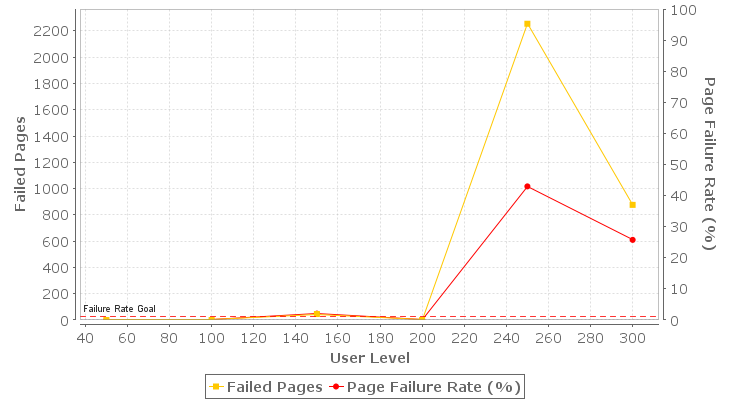
The failures section chart illustrates how the total number of page failures and the page failure rate changed throughout the test relative to the sample periods summarized for each user level. A page can fail for any number of reasons, including failures in the network and servers (web, application or database). See the Failures section of the report for details on the page failures encountered. In a well-performing system, this number should be zero.
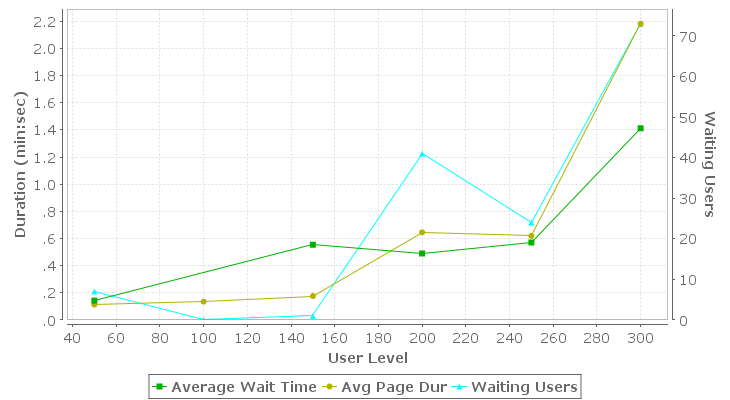
Waiting Users
The Waiting Users and Average Wait Time metrics help diagnose certain types of performance problems. For example, they can help determine what pages users have stopped on when a server becomes non-responsive. The 'Waiting Users' metric counts the number of users waiting to complete a web page at the end of the sample periods summarized for each user level. The 'Average Wait Time' describes the amount of time, on average, that each of those users has been waiting to complete the page.
Learn more about the Waiting User metrics by watching the Waiting Users screencast
Server Metrics
User Capacity
The User Capacity Analysis calculates how many users the application can support based on the configured performance goals, selected analysis methods and the performance of the system as measured during the test. Performance goals may be set on web pages, individual transactions or the entire test. The total number of items analyzed (as well as the break-down) is shown in the table below. The chart (and the subsequent table) shows the number of items that passed and failed their goals at each user level analyzed. Items listed as 'not evaluated' could not be evaluated because the item was not completed during the time period corresponding to that user level.
Learn how to intepret this report by watching the User Capacity screencast
| Estimated User Capacity | at least 100 |
| less than 150 | |
| Maximum Users Analyzed | 300 |
| Goals Analyzed | |
| Total | 8 |
| - Pages | 7 |
| - Transactions | 0 |
| - Test | 1 |
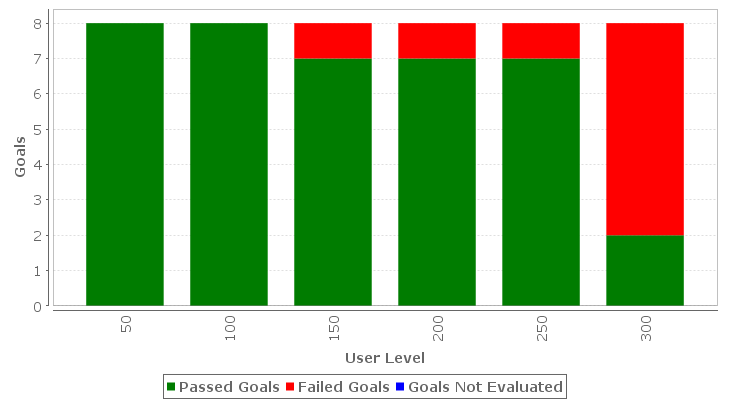
| User Level | Passed Goals | Failed Goals | Goals Not Evaluated |
| 50 | 8 | 0 | 0 |
| 100 | 8 | 0 | 0 |
| 150 | 7 | 1 | 0 |
| 200 | 7 | 1 | 0 |
| 250 | 7 | 1 | 0 |
| 300 | 2 | 6 | 0 |

Performance Goals
The Performance Goal section summarizes the performance goal compliance at each user level. Each goal will either pass, fail or be 'not evaluated' based on the selected analysis method(s) at each user level. Refer to the related section for a detailed list of goal compliance at the summary, page or transaction level.
Learn more about performance goals by watching the Performance Goals screencast
50 Users
All goals passed
100 Users
All goals passed
150 Users
1 goal failed
200 Users
1 goal failed
250 Users
1 goal failed
300 Users
6 goals failed
- Top-level Metrics
- Page: Issue Tracker - Login [1]
- Page: Issue Tracker - Issues [1]
- Page: Issue Tracker - Issues [2]
- Page: Issue Tracker - Issues [5]
- Page: Issue Tracker - Login [2]
Slowest Pages by Average Duration
The chart and table below show the 7 slowest pages, as determined by the page durations measured during the test. The table lists the pages along with the time that the peak duration was recorded, the number of users running the testcase at that time and the base duration of the page (as recorded). Refer to the related sections for more detailed analysis of each listed page and testcase.
User Level Analysis
This section summarizes the metrics by user level.
Learn more about User Level Analysis by watching the User Level Analysis screencast
| Testcase | Page Name | Avg Dur | Time | Users | Base Dur | |
| • | create new issue (1) | Issue Tracker - Issues [2] | 3.458 | 00:12:00 | 300 | .177 |
| • | create new issue (1) | Issue Tracker - Issues [5] | 2.502 | 00:12:00 | 300 | .330 |
| • | create new issue (1) | Issue Tracker - Issues [1] | 2.371 | 00:12:00 | 300 | .040 |
| • | create new issue (1) | Issue Tracker - Login [1] | 2.290 | 00:12:00 | 300 | .069 |
| • | create new issue (1) | Issue Tracker - Login [2] | 1.816 | 00:12:00 | 300 | .034 |
| • | create new issue (1) | Issue Tracker - Issues [4] | 1.536 | 00:12:00 | 300 | .069 |
| • | create new issue (1) | Issue Tracker - Issues [3] | 1.185 | 00:12:00 | 300 | .044 |
Time-based Analysis
| Testcase | Page Name | Avg Dur | Time | Users | Base Dur | |
| • | create new issue (1) | Issue Tracker - Issues [2] | 4.226 | 00:12:00 | 300 | .177 |
| • | create new issue (1) | Issue Tracker - Login [1] | 4.134 | 00:11:40 | 300 | .069 |
| • | create new issue (1) | Issue Tracker - Issues [5] | 3.508 | 00:12:00 | 300 | .330 |
| • | create new issue (1) | Issue Tracker - Issues [1] | 3.320 | 00:12:00 | 300 | .040 |
| • | create new issue (1) | Issue Tracker - Login [2] | 3.065 | 00:12:00 | 300 | .034 |
| • | create new issue (1) | Issue Tracker - Issues [4] | 2.009 | 00:11:40 | 300 | .069 |
| • | create new issue (1) | Issue Tracker - Issues [3] | 1.515 | 00:11:40 | 300 | .044 |
Slowest Pages by Maximum Duration
The chart and table below show the 7 slowest pages, as determined by the page durations measured during the test. The table lists the pages along with the time that the peak duration was recorded, the number of users running the testcase at that time and the base duration of the page (as recorded). Refer to the related sections for more detailed analysis of each listed page and testcase.
User Level Analysis
This section summarizes the metrics by user level.
Learn more about User Level Analysis by watching the User Level Analysis screencast
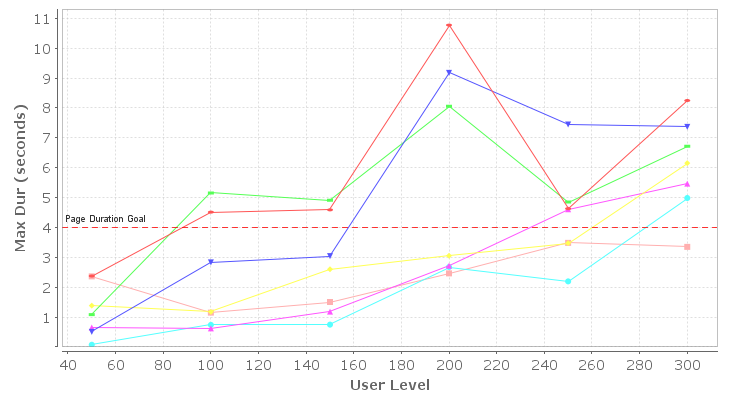
| Testcase | Page Name | Max Dur | Time | Users | Base Dur | |
| • | create new issue (1) | Issue Tracker - Issues [2] | 10.772 | 00:08:10 | 200 | .177 |
| • | create new issue (1) | Issue Tracker - Login [1] | 9.175 | 00:08:10 | 200 | .069 |
| • | create new issue (1) | Issue Tracker - Issues [3] | 8.054 | 00:08:10 | 200 | .044 |
| • | create new issue (1) | Issue Tracker - Issues [1] | 6.152 | 00:12:00 | 300 | .040 |
| • | create new issue (1) | Issue Tracker - Issues [5] | 5.468 | 00:12:00 | 300 | .330 |
| • | create new issue (1) | Issue Tracker - Login [2] | 4.984 | 00:12:00 | 300 | .034 |
| • | create new issue (1) | Issue Tracker - Issues [4] | 3.483 | 00:10:10 | 250 | .069 |
Time-based Analysis
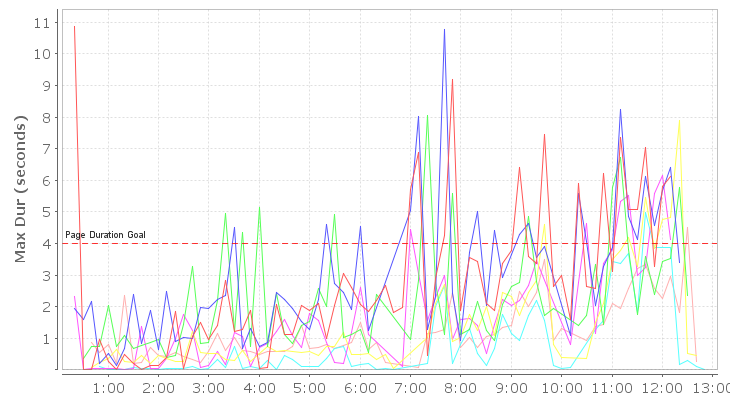
| Testcase | Page Name | Max Dur | Time | Users | Base Dur | |
| • | create new issue (1) | Issue Tracker - Login [1] | 10.872 | 00:00:20 | 22 | .069 |
| • | create new issue (1) | Issue Tracker - Issues [2] | 10.772 | 00:07:40 | 200 | .177 |
| • | create new issue (1) | Issue Tracker - Issues [3] | 8.054 | 00:07:20 | 200 | .044 |
| • | create new issue (1) | Issue Tracker - Issues [5] | 7.880 | 00:12:20 | 158 | .330 |
| • | create new issue (1) | Issue Tracker - Issues [1] | 6.152 | 00:12:00 | 300 | .040 |
| • | create new issue (1) | Issue Tracker - Login [2] | 4.984 | 00:11:40 | 300 | .034 |
| • | create new issue (1) | Issue Tracker - Issues [4] | 4.501 | 00:12:30 | 66 | .069 |
Failures
The failures section chart illustrates how the total number of page failures and the page failure rate changed throughout the test relative to the elapsed test time (sample period) in which they occurred. A page can fail for any number of reasons, including failures in the network and servers (web, application or database). See the Failures section of the report for details on the page failures encountered. In a well-performing system, this number should be zero.
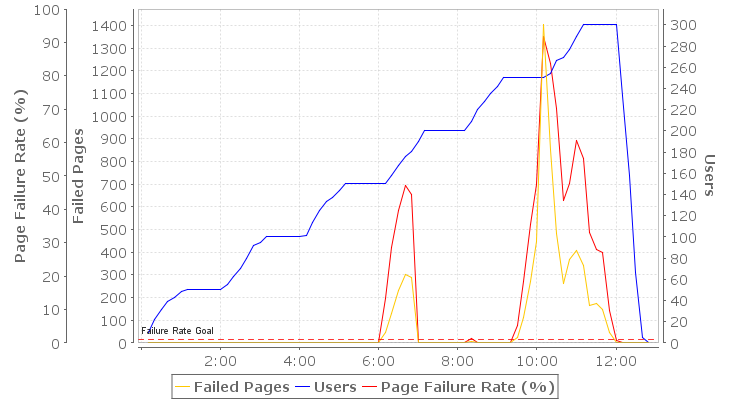
The following list describes the time, frequency (if configured), description and the related page or transaction for each failure detected during the test.
| Time | Description | Page or Transaction |
| 00:06:03 (1999 times) |
The status code of the response (200) did not match the status code of the response in the Testcase (302). | Object moved [3] |
| 00:06:03 (1999 times) |
The status code of the response (302) did not match the status code of the response in the Testcase (200). | Issue Tracker - Issues [1] |
| 00:06:03 (1999 times) |
Extractor could not locate content on page for variable(s):#btnAdd | Issue Tracker - Issues [1] |
| 00:08:12 (126 times) |
Unable to initiate connection to server because the OS cannot provide an open port. | styles.css |
| 00:08:12 (109 times) |
Unable to initiate connection to server because the OS cannot provide an open port. | ASP.NET-Logo-small.gif |
| 00:08:12 (54 times) |
Unable to initiate connection to server because the OS cannot provide an open port. | WebUIValidation.js |
| 00:08:13 (1216 times) |
Unable to initiate connection to server because the OS cannot provide an open port. | Object moved [1] |
| 00:08:13 (1209 times) |
Unable to initiate connection to server because the OS cannot provide an open port. | Object moved [2] |
| 00:08:13 (1209 times) |
Missing user variable: #ReturnUrl | Issue Tracker - Login [1] |
| 00:08:13 (58 times) |
Unable to initiate connection to server because the OS cannot provide an open port. | IssueTracker.gif |
| 00:10:08 (11 times) |
Unable to initiate connection to server because the OS cannot provide an open port. | SmartNav.htm |
Note: Duplicate failures are summarized
Note: Only the first 100 failures are shown
Load Configuration
Load Configuration
| Duration | 12 minutes |
| Start Users | 50 |
| Increment Users | 50 users over 1 minute every 2 minutes |
| Limit To | n/a |
| Estimated Peak Users | 300 |
| Testcase | Weight | % | Speed | Think Time | VU Start | Delay | |
| 1 | create new issue | 100 | 100.00% | 100 Mbps (Fast Ethernet) | 75% - 150% | Random | 1 sec |
Testcases
Testcase: create new issue
| Pages | 7 |
| URLs | 24 |
| Images | 6 |
| Total size | 542.9 KB |
| Average page size | 77.6 KB |
| Total image size | 5.0 KB |
| Average image size | 861 B |