| Load Test Report | |
| 50 + 50 up to 300 |
Page Analysis: Issue Tracker - Issues [5]
| Testcase | create new issue (1) |
| Page URL | http://issuetracker/IssueTracker/Issues/IssueList.aspx?pid=1 |
| Baseline Size | 50.2 KB |
| URLs | 5 |
| Baseline Duration | .330 |
| Performance Goal | 4.000 |
| Attempts | 2,816 |
| Completions | 2,816 |
| Successes | 2,658 |
| Failures | 158 |
| Average Duration | .724 |
| Total Duration | 34:01.346 |
Performance Goal Analysis
This section analyzes the performance using the selected analysis methods and the performance goals configured on the page.
Learn more about performance goals by watching the Performance Goals screencast
| User Level | Avg + 1 Std Dev | Avg + 2 Std Dev |
| 50 |  |
|
| 100 | |
|
| 150 | |
|
| 200 | |
|
| 250 | |
|
| 300 | |
 |

User Level Analysis
This section summarizes the metrics by user level.
Learn more about User Level Analysis by watching the User Level Analysis screencast
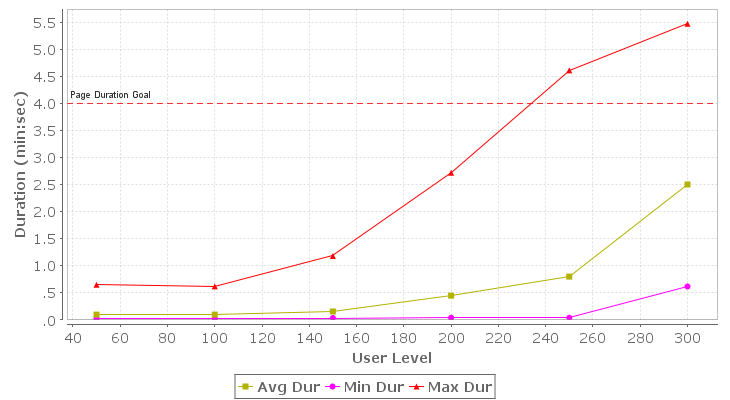
Page Duration
The duration chart shows the range of durations recorded for the item. The minimum, maximum and average values are computed for items that completed within the sample periods summarized for each user level.
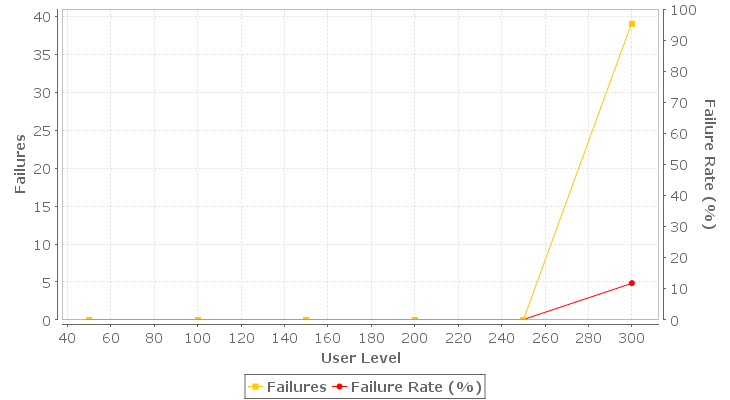
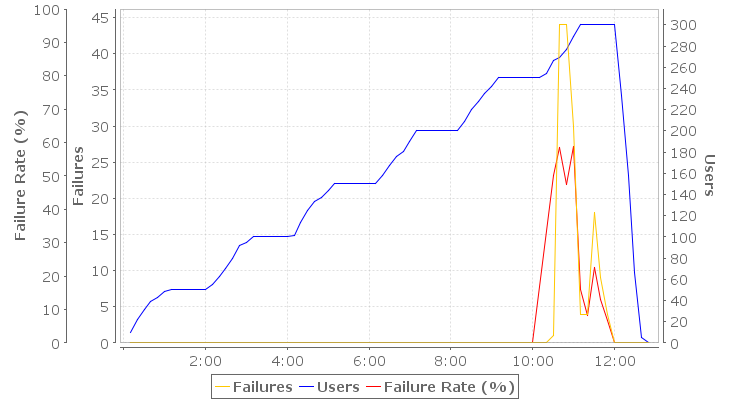
Failures
The failures chart shows the number of failures recorded for the item during the sample periods summarized for each user level and the rate of failures compared to the total attempts for this item. A failure of a page or transaction could indicate a wide variety of problems from an inability to establish a network connection to the server to the failure of a validator configured to check the returned content.
Waiting Users
The detailed durations chart plots each duration recorded for the item during the test. Gaps in the chart could indicate a period where an item was not being serviced by the application even though there were outstanding requests for the item. Used in conjunction with the Waiting Users chart, this can be used to identify stalling behavior on the server.
Learn more about the Waiting User metrics by watching the Waiting Users screencast
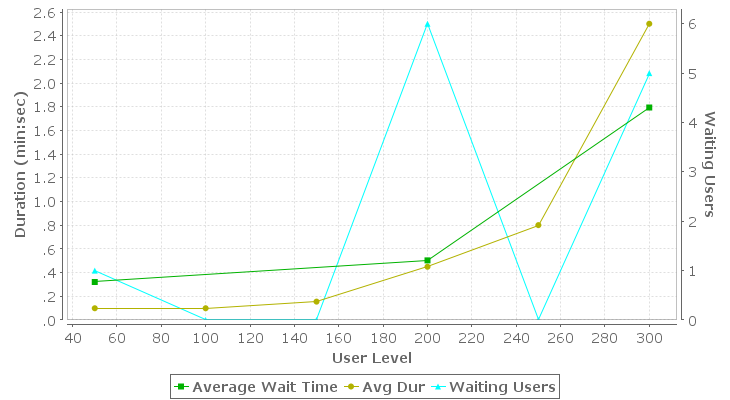
| User Level | Successes | Failures | Failure Rate | Avg Speed | Avg Size | Min Dur | Avg Dur | Max Dur | Waiting Users | Average Wait Time | Dur Std Dev |
| 50 | 88 | 0 | .00% | 4.5 Mbps | 50.7 KB | .028 | .099 | .650 | 1 | .321 | .122 |
| 100 | 181 | 0 | .00% | 4.3 Mbps | 50.8 KB | .029 | .099 | .621 | 0 | .106 | |
| 150 | 304 | 0 | .00% | 2.7 Mbps | 50.8 KB | .036 | .155 | 1.181 | 0 | .145 | |
| 200 | 379 | 0 | .00% | 1.4 Mbps | 53.4 KB | .041 | .450 | 2.718 | 6 | .503 | .433 |
| 250 | 359 | 0 | .00% | 1.2 Mbps | 53.2 KB | .041 | .801 | 4.609 | 0 | .766 | |
| 300 | 290 | 39 | 11.85% | 199.8 kbps | 55.3 KB | .618 | 2.502 | 5.468 | 5 | 1.795 | 1.061 |
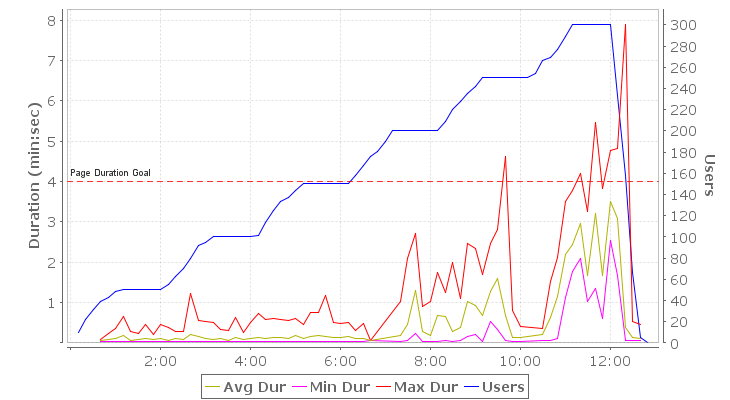
Time-based Analysis
Page Duration
The duration chart shows the range of durations recorded for the item. The minimum, maximum and average values are computed for items that completed within a sample period.
Failures
The failures chart shows the number of failures recorded for the item during each sample period and the rate of failures compared to the total attempts for this item. A failure of a page or transaction could indicate a wide variety of problems from an inability to establish a network connection to the server to the failure of a validator configured to check the returned content.
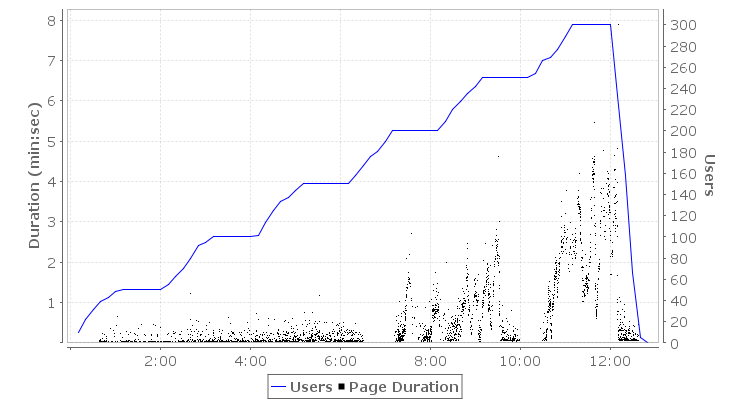
Detailed Page Durations
The detailed durations chart plots each duration recorded for the item during the test. Gaps in the chart could indicate a period where an item was not being serviced by the application even though there were outstanding requests for the item. Used in conjunction with the Waiting Users chart, this can be used to identify stalling behavior on the server.
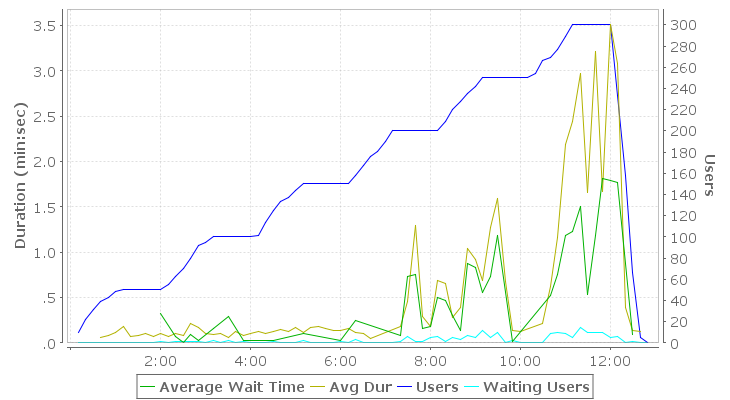
Waiting Users
The Waiting Users and Average Wait Time metrics help diagnose certain types of performance problems. For example, they can help determine what pages users have stopped on when a server becomes non-responsive. The 'Waiting Users' metric counts the number of users waiting to complete the item at the end of the sample period. The 'Average Wait Time' describes the amount of time, on average, that each of those users has been waiting.
Learn more about the Waiting User metrics by watching the Waiting Users screencast
| Time | Successes | Failures | Failure Rate | Avg Speed | Avg Size | Min Dur | Avg Dur | Max Dur | Waiting Users | Average Wait Time | Dur Std Dev |
| 00:00:10 | 0 | 0 | 0 | ||||||||
| 00:00:20 | 0 | 0 | 0 | ||||||||
| 00:00:30 | 0 | 0 | 0 | ||||||||
| 00:00:40 | 5 | 0 | .00% | 7.3 Mbps | 53.6 KB | .035 | .060 | .077 | 0 | .016 | |
| 00:00:50 | 17 | 0 | .00% | 5.2 Mbps | 53.4 KB | .038 | .083 | .246 | 0 | .063 | |
| 00:01:00 | 11 | 0 | .00% | 3.5 Mbps | 51.8 KB | .032 | .120 | .348 | 0 | .119 | |
| 00:01:10 | 9 | 0 | .00% | 2.3 Mbps | 50.7 KB | .033 | .184 | .650 | 0 | .209 | |
| 00:01:20 | 19 | 0 | .00% | 5.8 Mbps | 50.7 KB | .031 | .071 | .277 | 0 | .077 | |
| 00:01:30 | 12 | 0 | .00% | 5.0 Mbps | 50.7 KB | .030 | .083 | .237 | 0 | .075 | |
| 00:01:40 | 17 | 0 | .00% | 3.8 Mbps | 50.7 KB | .028 | .109 | .469 | 0 | .128 | |
| 00:01:50 | 14 | 0 | .00% | 5.5 Mbps | 50.8 KB | .029 | .076 | .213 | 0 | .066 | |
| 00:02:00 | 17 | 0 | .00% | 3.9 Mbps | 50.8 KB | .029 | .107 | .446 | 1 | .321 | .134 |
| 00:02:10 | 13 | 0 | .00% | 5.7 Mbps | 50.8 KB | .028 | .073 | .378 | 0 | .098 | |
| 00:02:20 | 14 | 0 | .00% | 3.8 Mbps | 50.8 KB | .028 | .109 | .272 | 1 | .075 | .094 |
| 00:02:30 | 21 | 0 | .00% | 5.3 Mbps | 50.8 KB | .030 | .077 | .282 | 1 | .006 | .080 |
| 00:02:40 | 14 | 0 | .00% | 2.0 Mbps | 50.8 KB | .033 | .212 | 1.220 | 1 | .091 | .316 |
| 00:02:50 | 23 | 0 | .00% | 2.5 Mbps | 50.8 KB | .031 | .168 | .558 | 1 | .026 | .144 |
| 00:03:00 | 23 | 0 | .00% | 4.1 Mbps | 50.8 KB | .029 | .102 | .527 | 0 | .113 | |
| 00:03:10 | 32 | 0 | .00% | 4.3 Mbps | 50.8 KB | .031 | .096 | .517 | 2 | .159 | .122 |
| 00:03:20 | 32 | 0 | .00% | 4.0 Mbps | 50.8 KB | .031 | .104 | .335 | 0 | .080 | |
| 00:03:30 | 20 | 0 | .00% | 6.7 Mbps | 50.8 KB | .029 | .062 | .303 | 2 | .290 | .070 |
| 00:03:40 | 37 | 0 | .00% | 3.2 Mbps | 50.8 KB | .031 | .130 | .621 | 0 | .131 | |
| 00:03:50 | 31 | 0 | .00% | 4.9 Mbps | 50.8 KB | .031 | .084 | .262 | 1 | .026 | .067 |
| 00:04:00 | 29 | 0 | .00% | 4.0 Mbps | 50.8 KB | .030 | .104 | .519 | 0 | .121 | |
| 00:04:10 | 29 | 0 | .00% | 3.3 Mbps | 50.8 KB | .030 | .126 | .739 | 0 | .137 | |
| 00:04:20 | 32 | 0 | .00% | 4.1 Mbps | 50.8 KB | .030 | .100 | .571 | 0 | .106 | |
| 00:04:30 | 30 | 0 | .00% | 3.4 Mbps | 50.8 KB | .036 | .124 | .615 | 1 | .025 | .127 |
| 00:04:40 | 29 | 0 | .00% | 2.9 Mbps | 50.8 KB | .038 | .144 | .592 | 0 | .121 | |
| 00:04:50 | 47 | 0 | .00% | 3.4 Mbps | 50.8 KB | .036 | .123 | .549 | 0 | .115 | |
| 00:05:00 | 38 | 0 | .00% | 2.4 Mbps | 50.8 KB | .034 | .176 | .598 | 0 | .135 | |
| 00:05:10 | 33 | 0 | .00% | 3.5 Mbps | 50.8 KB | .036 | .118 | .467 | 2 | .099 | .104 |
| 00:05:20 | 44 | 0 | .00% | 2.4 Mbps | 50.8 KB | .037 | .170 | .752 | 0 | .169 | |
| 00:05:30 | 53 | 0 | .00% | 2.3 Mbps | 50.8 KB | .037 | .184 | .757 | 0 | .149 | |
| 00:05:40 | 46 | 0 | .00% | 2.5 Mbps | 50.8 KB | .041 | .165 | 1.181 | 0 | .184 | |
| 00:05:50 | 35 | 0 | .00% | 3.1 Mbps | 50.8 KB | .037 | .135 | .505 | 0 | .112 | |
| 00:06:00 | 54 | 0 | .00% | 2.9 Mbps | 50.8 KB | .037 | .143 | .478 | 1 | .028 | .127 |
| 00:06:10 | 39 | 0 | .00% | 2.7 Mbps | 50.8 KB | .038 | .156 | .515 | 0 | .127 | |
| 00:06:20 | 44 | 0 | .00% | 3.6 Mbps | 50.8 KB | .038 | .114 | .317 | 3 | .250 | .094 |
| 00:06:30 | 36 | 0 | .00% | 4.1 Mbps | 50.8 KB | .040 | .100 | .483 | 0 | .095 | |
| 00:06:40 | 1 | 0 | .00% | 8.5 Mbps | 50.8 KB | .049 | .049 | .049 | 0 | .000 | |
| 00:06:50 | 0 | 0 | 0 | ||||||||
| 00:07:00 | 0 | 0 | 0 | ||||||||
| 00:07:10 | 0 | 0 | 0 | ||||||||
| 00:07:20 | 70 | 0 | .00% | 2.4 Mbps | 54.1 KB | .041 | .184 | 1.026 | 1 | .080 | .175 |
| 00:07:30 | 104 | 0 | .00% | 949.0 kbps | 53.3 KB | .051 | .460 | 2.097 | 6 | .738 | .400 |
| 00:07:40 | 23 | 0 | .00% | 337.8 kbps | 53.2 KB | .237 | 1.291 | 2.718 | 1 | .758 | .559 |
| 00:07:50 | 18 | 0 | .00% | 1.5 Mbps | 53.2 KB | .046 | .292 | .893 | 1 | .158 | .257 |
| 00:08:00 | 76 | 0 | .00% | 2.3 Mbps | 53.2 KB | .044 | .187 | 1.038 | 5 | .177 | .161 |
| 00:08:10 | 88 | 0 | .00% | 631.1 kbps | 53.2 KB | .042 | .691 | 1.755 | 6 | .503 | .334 |
| 00:08:20 | 27 | 0 | .00% | 661.3 kbps | 53.2 KB | .066 | .659 | 1.262 | 1 | .463 | .298 |
| 00:08:30 | 41 | 0 | .00% | 1.5 Mbps | 53.2 KB | .045 | .286 | 1.992 | 5 | .306 | .329 |
| 00:08:40 | 89 | 0 | .00% | 1.1 Mbps | 53.2 KB | .054 | .386 | 1.094 | 3 | .136 | .230 |
| 00:08:50 | 62 | 0 | .00% | 419.6 kbps | 53.2 KB | .152 | 1.039 | 2.460 | 7 | .871 | .497 |
| 00:09:00 | 43 | 0 | .00% | 471.5 kbps | 53.2 KB | .208 | .925 | 2.333 | 5 | .829 | .456 |
| 00:09:10 | 56 | 0 | .00% | 632.1 kbps | 53.2 KB | .041 | .689 | 1.708 | 12 | .554 | .469 |
| 00:09:20 | 79 | 0 | .00% | 341.6 kbps | 53.2 KB | .526 | 1.276 | 2.463 | 5 | .728 | .356 |
| 00:09:30 | 55 | 0 | .00% | 274.5 kbps | 53.2 KB | .337 | 1.588 | 2.818 | 10 | 1.180 | .782 |
| 00:09:40 | 70 | 0 | .00% | 638.3 kbps | 53.2 KB | .052 | .683 | 4.609 | 0 | .892 | |
| 00:09:50 | 52 | 0 | .00% | 3.1 Mbps | 53.2 KB | .047 | .140 | .797 | 2 | .014 | .150 |
| 00:10:00 | 47 | 0 | .00% | 3.4 Mbps | 53.2 KB | .048 | .127 | .407 | 0 | .085 | |
| 00:10:10 | 0 | 0 | 0 | ||||||||
| 00:10:20 | 0 | 0 | 0 | ||||||||
| 00:10:30 | 1 | 1 | 50.00% | 2.2 Mbps | 56.2 KB | .061 | .214 | .367 | 0 | .153 | |
| 00:10:40 | 31 | 44 | 58.67% | 717.5 kbps | 54.4 KB | .050 | .620 | 1.511 | 9 | .525 | .432 |
| 00:10:50 | 49 | 44 | 47.31% | 380.9 kbps | 54.0 KB | .121 | 1.161 | 2.108 | 10 | .758 | .545 |
| 00:11:00 | 21 | 30 | 58.82% | 200.8 kbps | 53.6 KB | 1.115 | 2.184 | 3.499 | 9 | 1.187 | .524 |
| 00:11:10 | 21 | 4 | 16.00% | 184.5 kbps | 55.2 KB | 1.767 | 2.448 | 3.768 | 5 | 1.231 | .431 |
| 00:11:20 | 44 | 4 | 8.33% | 152.8 kbps | 55.4 KB | 2.091 | 2.972 | 4.191 | 15 | 1.505 | .526 |
| 00:11:30 | 62 | 18 | 22.50% | 270.5 kbps | 54.9 KB | 1.025 | 1.663 | 3.269 | 10 | .532 | .521 |
| 00:11:40 | 60 | 9 | 13.04% | 141.0 kbps | 55.2 KB | 1.355 | 3.210 | 5.468 | 10 | 1.181 | 1.101 |
| 00:11:50 | 56 | 4 | 6.67% | 272.1 kbps | 55.5 KB | .618 | 1.669 | 3.837 | 10 | 1.816 | .876 |
| 00:12:00 | 47 | 0 | .00% | 130.0 kbps | 55.7 KB | 2.540 | 3.508 | 4.767 | 5 | 1.795 | .473 |
| 00:12:10 | 48 | 0 | .00% | 147.7 kbps | 55.7 KB | 1.671 | 3.087 | 4.810 | 6 | 1.771 | .758 |
| 00:12:20 | 84 | 0 | .00% | 1.2 Mbps | 55.7 KB | .049 | .391 | 7.880 | 0 | .867 | |
| 00:12:30 | 86 | 0 | .00% | 3.3 Mbps | 55.7 KB | .049 | .139 | .521 | 1 | .088 | .110 |
| 00:12:40 | 48 | 0 | .00% | 3.7 Mbps | 55.7 KB | .049 | .123 | .450 | 0 | .101 | |
| 00:12:50 | 0 | 0 | 0 |