Solving Server Problems with the Waiting Users and Average Wait Time Metrics
Load Tester added two important new metrics in the 3.6 release: Waiting Users and Average Wait Time. In this tutorial we’ll describe how they’re used, and as we take a look at an example load test report we’ll use them to help us diagnose a tricky server problem.
A Test Report with a Problem
Before we describe the new metrics, lets take a look at some very interesting load test results.
In the charts below you can see a test that ran for somewhere around twelve minutes, ramping from zero to a hundred users, twenty users at a time.
First we’ll inspect the page-duration section, where we see the average, minimum and maximum page durations for all the pages. As the users ramped up, 20, 40, 60, all the way up to 100, the average page durations stayed relatively constant, well under half a second. It was very good performance, overall.
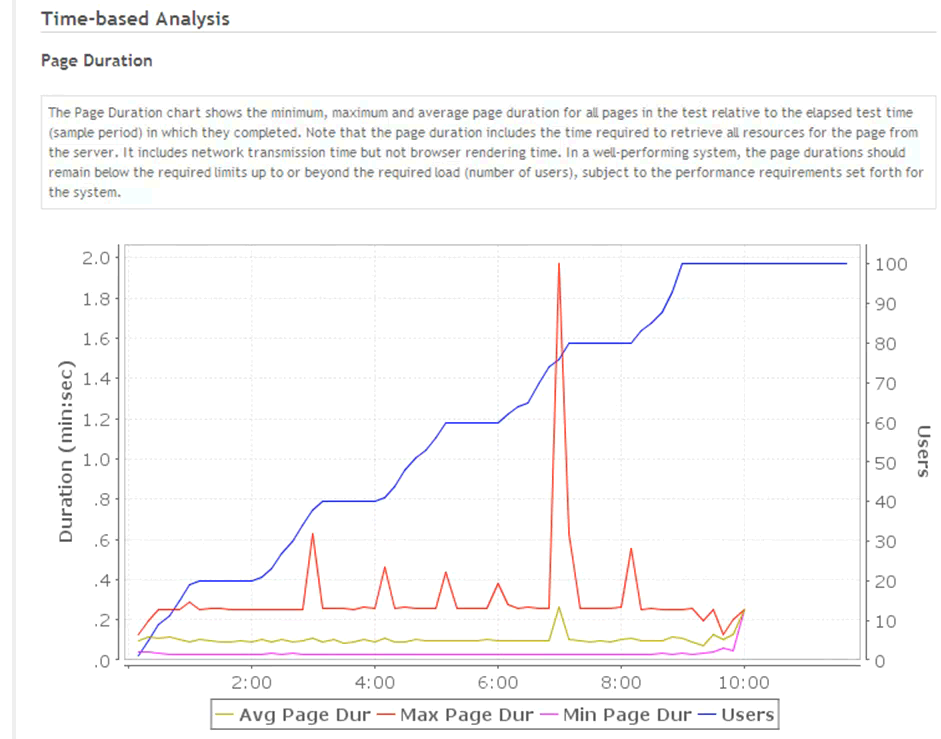
Based solely on this chart, it looks as if the system is performing very well.
Looking Closer
Let’s take a look at another chart, page completion rate, or pages per second. It’s obvious that the pages per second ramped nicely with the load until about the eight-minute mark. At that point page completion dropped off pretty dramatically. By the ten-minute mark there were essentially zero pages per second being serviced, even though a hundred users were being simulated.
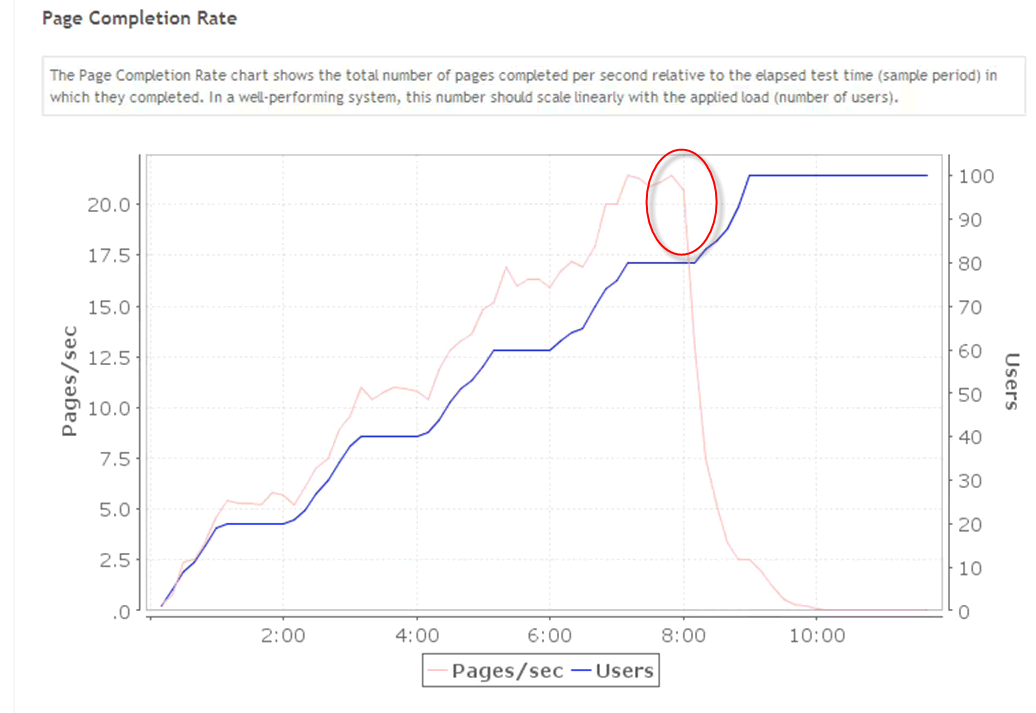
The failures metric has recorded no failed pages.
Checking CPU Usage on the Server
One of the next things to check when we see this sort of problem is the performance of the server. We had our server-monitoring agent installed on the server for this test. We’ll look at the summary for this particular server.
On the chart, on the blue plot, we can see that the CPU scaled nicely with load. It was running about 15 to 20 percent at 80 users and then it started to drop off (as did bandwidth and disk I/O).
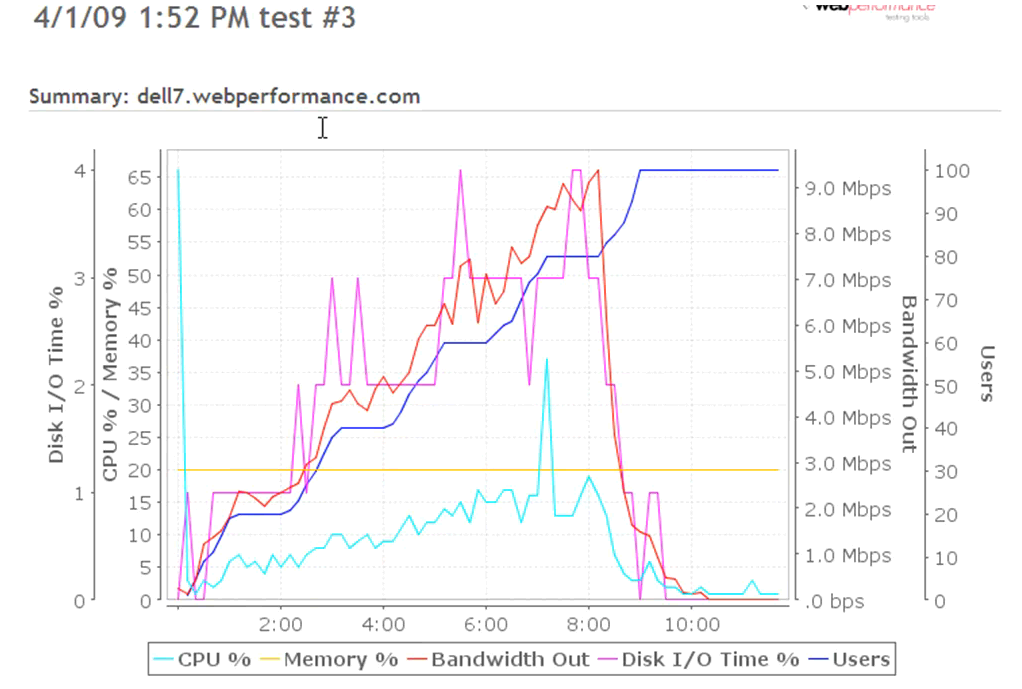
Combining these various data points we’ve looked at so far, we know that the duration of completed pages have remained low, but throughput has dropped dramatically and the web server appears to be idle. On the surface this appears to be illogical. A novice tester might even conclude that the testing software has failed.
Inspecting the Waiting Users and the Average Wait Time
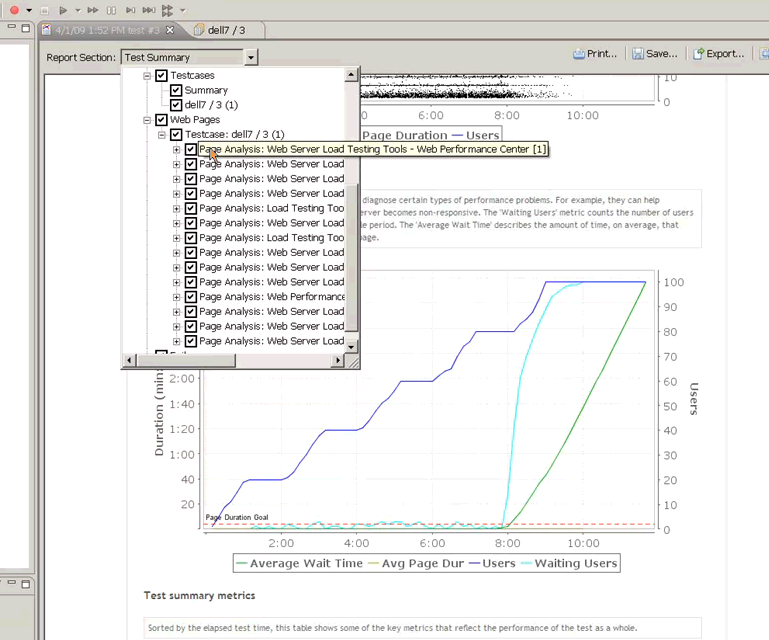
This scenario illustrates exactly why we deveolped the Waiting Users and Average Wait Time metrics. Let’s see how they work. We’re going to return to the test summary section of the report and examine the waiting users chart.
What Does Waiting Users Measure?
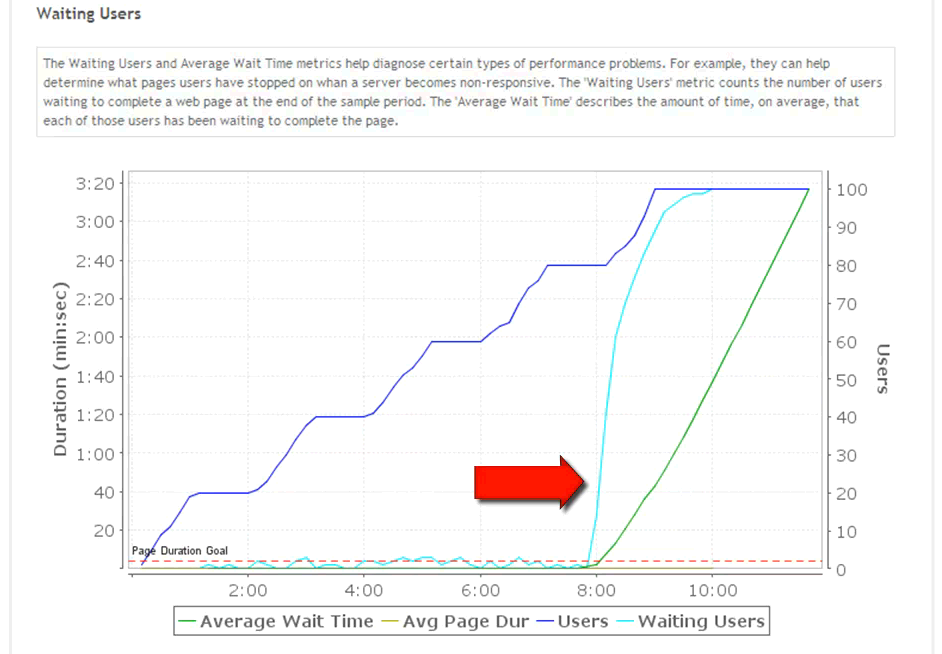
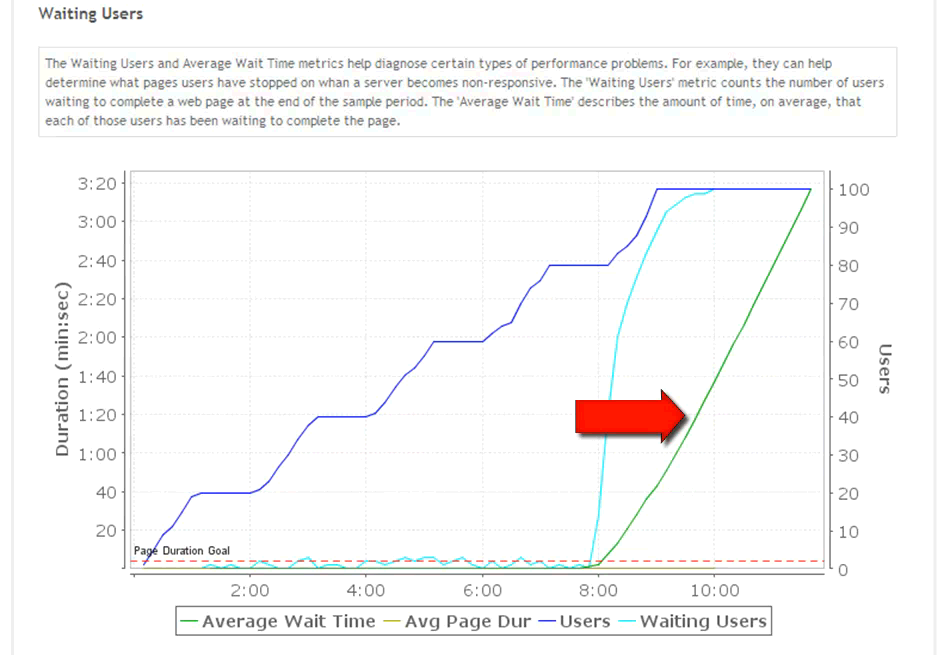
The waiting users metric, shown below in the light blue line, counts the number of users that are working on a page or transaction (the dark blue is the total number of users). More precisely, it is the number of users that are waiting for something from the server at the end of the sample. We expect to see some number of users waiting, at any point during a test. The percentage of the total users that are waiting will naturally vary based on the duration of the pages, the amount of think time between pages, the overall density of the test, and a number of other factors. In general, we expect it to be only a small percentage of the overall users, and we expect it to rise linearly as load increases.
What we see here, though, is that slightly before the eight-minute mark the number of waiting users started to rise very quickly. Within less than two minutes, one hundred percent of the users were waiting on something from the server.
What Does Average Wait Time Measure?
The Average Wait Time, shown here in the green line, is the amount of time, on average, that each of the waiting users has been waiting at the end of the sample. Be careful not to confuse this with Average Page Duration – which is the average of the duration of all pages that completed during the sample. Average Wait Time is a snapshot at the instant the sample was taken – it is an average of how long users have been waiting on pages that have not yet completed.
Now, if we had allowed this test to run longer, we would have seen either an increase in the page durations, with a spike when these pages that had been delayed started to finish, or else we would have seen some errors generated. The errors might be timeouts at the network level or within Load Tester, when the network or the Load Tester decided that the current page simply was not going to finish and that a retry would be needed.
In previous versions of Load Tester, and indeed in most other load testing tools today, you would need to start with the long page durations that were recorded, and track backwards in time to determine when the problem actually began, in order to help you narrow down to the source of the problem. With the Waiting Users and Average Wait Time metrics we can see exactly where the problem began.
Why do we want to know when the problem started? Suppose the problem that we are examining was due to a filled database connection pool. An application server’s pool might be filling up at 80 users and then failing, preventing all future users from getting connections to the database. It would be valuable to know that this problem started at 80 users, not at 100, 120, 140, which are plausible points at which we might eventually see the average page durations start to increase.
So, from this chart it’s relatively easy to see that all the users were waiting on something. Fortunately, the waiting users metric is recorded not only in the summary level, that is, for everything in the test, but it’s recorded for each page and transaction.
That allows us to drill down to specific pages and see how many users were waiting on that particular page at any point in time. We’re going to go to one of the pages in the test here.
Next we’ll scroll down to the waiting users chart.
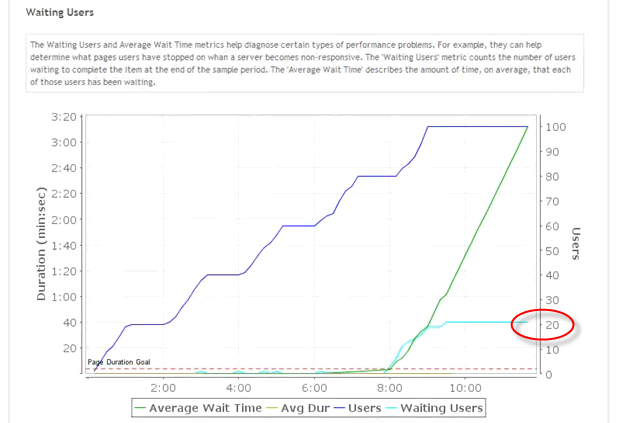
From this chart, we can see that slightly more than twenty users were waiting at the end of the test on this particular page.
In this case there are still 80 users unaccounted for. If we look through the other pages we can find each page where users were waiting. In this example, the problem is system-wide, so almost all pages are affected. In many cases only specific pages will be affected. Checking the Waiting Users chart for each page helps you isolate the problem to those pages.
What Have We Learned?
These results, using the waiting users metric, have shown us that users are getting stuck on particular URLs and are not getting any responses back from the server.
Using the Waiting Users metric we can drill down to individual pages and transactions to determine where and when users get stuck waiting for something from the server. We can then use that information to narrow down the problem – to determine, for instance, if this is a system-wide problem or is specific to particular site operations or sub-systems.
When his dad brought home a Commodore PET computer, Chris was drawn into computers. 7 years later, after finishing his degree in Computer and Electrical Engineering at Purdue University, he found himself writing software for industrial control systems. His first foray into testing software resulted in an innovative control system for testing lubricants in automotive engines. The Internet grabbed his attention and he became one of the first Sun Certified Java Developers. His focus then locked on performance testing of websites. As Chief Engineer for Web Performance since 2001, Chris now spends his time turning real-world testing challenges into new features for the Load Tester product.