Servlet Container Performance Report
Comparing The Performance of J2EE Servers
Christopher L Merrill
©2004 Web Performance, Inc; July 7, 2004; v2.2
Contents
- Introduction
- The Servers
- Testing goals
- The Tests
- Methodology
- Results
- Analysis
- Future Directions
- Feedback & Comments
- Version History
Introduction
The standardization of the application server, thanks to Sun's J2EE specifications, has spawned a wealth of implementations. There are offerings from big players such as Sun, BEA, IBM and Oracle as well as numerous offerings from low-cost vendors and the open-source community.
Like most developers, I participate in a number of technical forums and mailing lists. A recurring topic on servlet-development forums is “Which J2EE server should I use for my servlet-based application?” There are a number of criteria for selecting a server: ease of installation, quality of documentation, reliability, cost and performance. Some of these aspects are readily apparent to the evaluator; but performance seems to generate a lot of discussion with a notable lack of facts. After a quick search, I was surprised that few usable benchmarks have been published comparing the servlet performance of the popular low-cost servers.
ECPerf
Recently, an industry coalition has come together to produce ECPerf – a “benchmark and implementation for measuring performance and scalability of J2EE servers”. Some results of this benchmark linked from this page. However, this benchmark is not useful for organizations that have chosen to use servlets and JSP, but not EJBs. Additionally, the organization membership primarily consists of the largest vendors. Popular low-cost and open source servers are not represented. Perhaps most important, ECPerf does not test all servers on the same hardware – which skews the results towards the vendors that choose to fund extravagant hardware configurations. While I applaud the goals motivating the development of ECPerf, I believe it fails to provide the necessary information for the majority of projects.
Motivation
There are no hidden objectives here: my personal curiosity was the driving factor that initiated this effort. The development and testing for this report is funded solely by our company as an effort to contribute back to the Java community from which we have gained so much. Except for compatibility testing, we do not use any of the servers in this report for corporate IS services and we have no preference between them. We have not received compensation, in any form, from any companies represented in the report.
disclaimer: All statements and opinions made in this document are solely those of the author. They do not represent the views and/or policies of Web Performance, Inc.
The Servers
- Tomcat 4.1.12
- IronFlare Orion 1.5.2
- Jetty 4.1.1
- Caucho Resin 2.1.5
- Sun ONE 7.0
- IBM WebSphere 4.0 (Advanced Single-Server)
Several servers were originally targeted for this report that could not be included for various reasons. The lowest-cost (e.g. single-server) versions of BEA Weblogic and Pramati Server were excluded because their license agreements prohibit the publication of performance benchmarks without permission. Permission was requested from these vendors, but the requests have been denied. If you would like to see these vendors included in the next version of this report, contact them and ask them to remove the no-benchmarking clause from their license agreement (or a least give us permission to release our results). JRun and ServletExec were also targeted for this report. JRun was unable to run our tests properly and Allaire did not respond to our request for assistance. ServletExec is not a standalone server (even though their marketing materials claim it is): it is a servlet plug-in for other web servers.
Testing goals
The purpose is not to declare a 'winner' - that is best left to publications seeking advertising revenue. Instead, this report provides a number of different measurements of server performance under load. The data is presented along with some analysis and commentary. Choosing a winner is left to the reader.
Usage Scenario
This report is intended to evaluate the servlet performance of a standalone server. This is expected to be applicable to small-to-medium projects that are deploying applications in departmental environments. It is not intended to represent the performance of the server in a clustered or distributed environment. Nor is it expected to reflect the performance of a server that has been highly optimized to achieve maximum performance for a particular application.
Difficulties of Benchmarking
There is no expectation that this report will be the authoritative, last word on the performance of servlet containers. Any given application will stress different parts of a server. Some applications will run better on some servers than others. Hopefully, this report provides data that helps the reader weigh the performance trade-offs of various servers.
Raw Numbers vs. Relative Performance
Due to the variability of application and hardware configurations, this report can not tell you how many users your application will be able to handle in your environment (which is why we sell a product for exactly that purpose!). This report will produce numbers such as hits/sec and average page duration, but the raw numbers have little value by themselves. Only when the statistics are compared against the other servers do they provide valuable data on which to make performance judgments.
It may seem obvious to some, but it is important to reinforce this point: If the data for this test indicates that Server X can serve 200 hits/sec with an average duration under 2 seconds, there is no correlation to the number of hits/sec that your application will be capable of. The data presented here for Server X is ONLY useful for comparison against the data for Server Y and Server Z, under the identical test conditions of our test lab. Additionally, please note the hardware used for the server during these tests (see Hardware Configuration, below) is by no means a state-of-the-art configuration.
Out-of-the-box Performance
It is useful to know how these servers will perform immediately after installation. A large number of projects do not have the expertise or the resources to perform extensive performance tuning. This test will only allow tuning of a few basic configuration parameters (see the Methodology section).
Reproducible Results
No matter how this testing is performed, someone will scream "Foul Play!" In fact, a number of revisions of this report are expected based on feedback from the community. A primary goal of this effort is a test that is easily duplicated by anyone else who wants to try. No doubt the exact numbers will not be duplicated, due to differences in hardware and measurement technique, but the relative differences between the servers should be reproducible.
The file containing the details of the usage scenarios, the construction of the test scripts and the test results is available here (22Mb). This file may be used with an evaluation copy of the testing software, Web Performance Trainer, to inspect these details. However, the evaluation license is limited to simulate 20 users; therefore the servers cannot be significantly stressed with an evaluation license. If you have other load-testing tools available, the results should be reproducible in those tools.
Servlet Aspects
It is reasonable to expect that different servers will excel at different aspects of servlet execution. This report will attempt to separate these aspects into separate tests:
- raw servlet execution
- static file serving
- session-tracking (future)
- resource pool allocation (future)
The Tests
User scenarios
Despite the fact that any performance test can serve only as a poor approximation of a real-world use case, it was important to choose user scenarios that are at least remotely similar to the kind of usage that will be typical in production deployments. The server statistics for our own website provided inspiration. After a detailed analysis of the paths and pages that are traversed on our website, a few common websites (yahoo, amazon, etc.) were also analyzed. Three user scenarios were chosen for the report:
| scenario | duration | # of pages | page sizes | # resources (images, etc) | resource sizes (bytes) |
|---|---|---|---|---|---|
| Short - represents frequently-used pages (e.g. home pages and corporate portals) and bookmarked pages that are checked occasionally | 10 seconds | 1 | 60k | 30 | 500 (x15) 2,500 (x10) 5,000 (x4) 10,000 |
| Medium - represents a short operation on a website (e.g. a quick product search or shipping status check on an e-commerce site) | 1 minute | 5 | 60k 40k 20k (x3) | 50 | 500 (x27) 2,500 (x14) 5,000 (x4) 10,000 (x5) |
| Long - represents long, involved operations on a website (e.g. placing an order and entering payment and shipping information) | 3 minutes | 20 | 60k (x4) 40k (x4) 20k (x12) | 125 | 500 (x72) 2,500 (x29) 5,000 (x4) 10,000 (x20) |
The scenarios take into account a common website property: The first page contains a lot of graphics, many of which are re-used on future pages. Assuming the cache on the browser is enabled these resources will not be requested again. This is why the Short scenario contains 30 resources on a single page and the Medium scenario contains only slightly more resources (50) on 5 pages.
User distribution
Based on the distribution observed in our server statistics, the distribution of the scenarios was chosen (below, middle). During the simulation, each virtual (simulated) user will execute a single scenario repeatedly, until the end of the test. After compensating for the differences in the length of each scenario, the final user distribution could be calculated (below, right).
| scenario | scenario distribution | user distribution |
|---|---|---|
| Short | 40% | 5% |
| Medium | 35% | 30% |
| Long | 25% | 65% |
Bandwidth distribution
Public websites and intranet applications see a distinctively different distributions of user bandwidth. For public websites, 56k to 1Mbit connections are typical. For intranet applications, 10Mbit to 100Mbit are common (this bandwidth is shared). 1Mbit bandwidth per user was selected for simulation purposes. The bandwidth is limited for each virtual user by the testing tool.
Note that with a bandwidth per user of 1Mbit on a 100Mbit network, no more than 100 users could be supported using their full bandwidth (assuming 100% network efficiency - which Ethernet cannot achieve). However, all the scenarios contain significant 'think time' (time between pages) that allows more than 100 users to utilize the 100Mbit bandwidth. None of the servers had the capacity to allow full saturation of the network bandwidth - and therefore does not affect the test results.
Construction of Test Cases
The test case requires a servlet that can return web pages of a specified length and referencing a specified number of external resources (images are used for this simulation). The servlet used in the test provides the required functionality hard-coded in the servlet. The source code for the servlet can be seen here. Once the servlet and necessary resources have been installed (via a WAR file), the test tool is used to record the scenarios interactively using a web browser. Internet Explorer 5.5 was used, but the choice of browser used to record the scenarios should have no effect on the test. Each scenario was recorded over the duration listed above. The testing tool will simulate the scenario using the same think time (delay between pages/URLs) present during the recording.
The complete WAR file deployed to the servers is available here.
Several test cases have been constructed to exercise various aspects of the server performance:
- Servlet-only - Exercise only the servlet-execution environment. No requests are made for external resources.
- Servlet and resources - Exercise the servlet and static-resource handling aspects of the server.
Methodology
Hardware configuration
Since each server is run on the same machine, the specific hardware used is irrelevant. But since someone will ask: it is a Dell PowerEdge 300 server (850MHz PIII, 512M RAM). Since the most common deployment for these servers will be Windows, the servers are run on Windows 2000 Server, Service Pack 2.
The load-generating machines are run on multiple platforms in our test lab, including Windows (2000, NT4 and XP), RH Linux (8.x) and Solaris 8. The machines all have 100Mb Ethernet adapters.
The load-generators and server are connected via a Netgear FS524 Fast Ethernet Switch. During the tests, this network is isolated from any other networks.
Install, Configure & Run the Server
Servers are all tested in their default configuration with these exceptions:
- Set the JVM heap memory limits to 350M starting and maximum.
- If there is a setting for maximum simultaneous connections, set this value to infinite if possible, or to the largest number it will accept.
If the server's installation package is bundled with a JVM, then it is used. If it requires the use of an external JVM, the Sun JDK 1.4.1 is used.
The detailed steps used to install, configure and run each server are listed here.
Once the server is running, the servlet used for testing is exercised, both to verify correct configuration and to ensure the servlet has been loaded and initialized prior to beginning each test.
Run the tests
The test is run starting with 20 virtual users. Each minute, 20 additional virtual users are added at random intervals, until the test is complete. Data is collected and summarized at 60 second intervals.
End the test
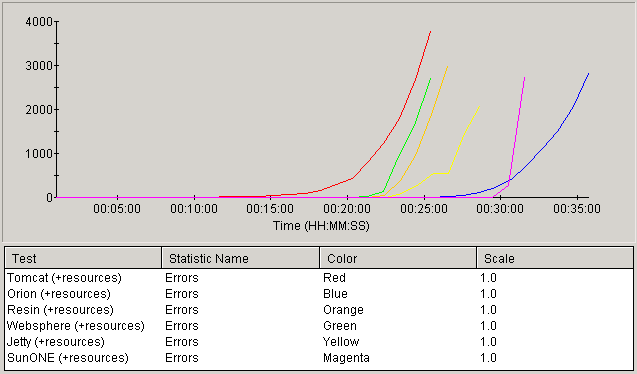
Each test is ended when the server has exceeded its maximum capacity. When a server has reached its capacity, one of two things happens: 1) errors are generated or 2) page load times increase. The most common error is exhibited by the server refusing a connection, which is recorded as an error by the testing tool. When the error count exceeds 3000, the test is halted. All but one of the servers exhibited this behavior under load. The Sun ONE server is the exception - it ran for double the duration of the others without ever exceeding the error threshold - it responded to load by exhibiting significantly longer page load times. The test of the Sun ONE server was halted shortly after the maximum duration of the other tests.
Persistent Connections
For details about persistent connections in this test, see this addendum.
Results: Servlet Performance
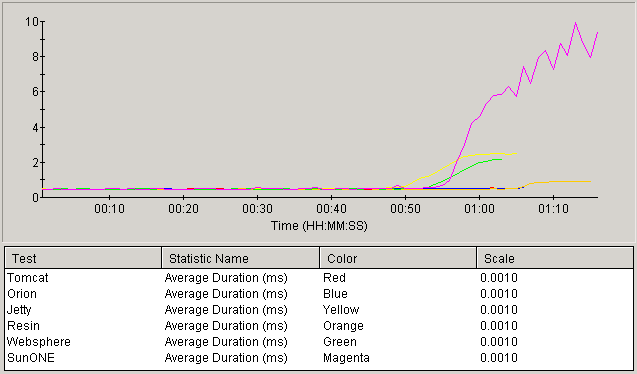
When examining the characteristics of a server under load, two of the most important statistics are the page duration and the error count. One of these two will increase as the load exceeds the server's capacity - giving us a clue to the maximum capacity.
When looking at the Average Page Duration, all the servers demonstrated nearly the same response time (approximately 0.5 second) when not loaded. As the load increased, the response times for Tomcat and Orion did not degrade noticeably - quite impressive! Resin only degraded slightly. The response times degraded substantially for the Sun ONE server under load. Jetty and Websphere took up the middle ground.
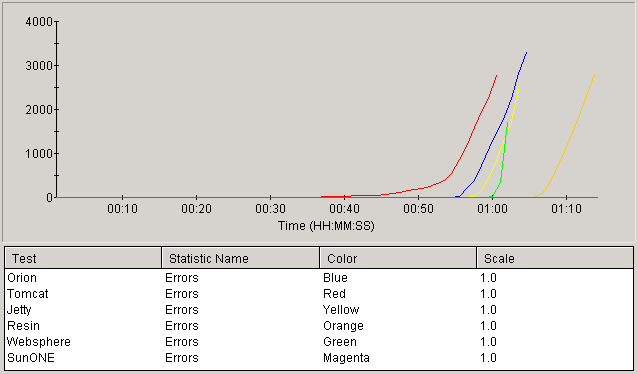
When looking at the error count, the performance of Tomcat and Orion don't look quite as impressive - they started refusing connections earlier than the other servers, which may explain why they were able to continue responding quickly under heavy load. The rapidly degrading response time of the Sun ONE server may also be explained by the fact that it never rejected any requests during the test - an admirable quality. Websphere and Jetty continue to cover the middle ground, with Resin handling the largest load before generating errors.
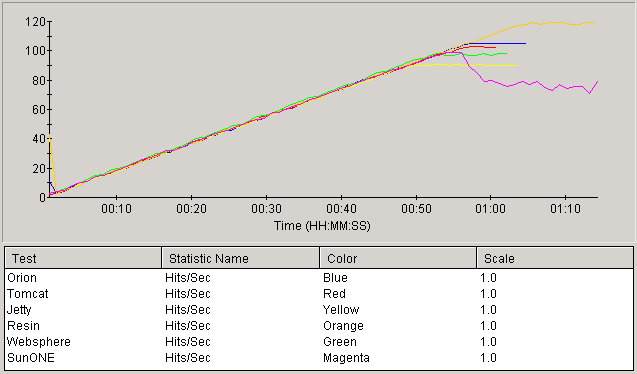
The Hits/Sec statistic somewhat summarizes the previous two data points by measuring the number of requests handled successfully, per unit time. This graph shows that most of the servers indicate their capacity with a distinct performance plateau. Tomcat, Orion, Jetty and Websphere are tightly bunched, with Resin showing a capacity nearly 20% higher than the best of that group. The Sun ONE server again shows a distinctive performance characteristic: the peak is right in the middle of the main pack but degrades from there - which could be due to it's "never refuse a connection" behavior.
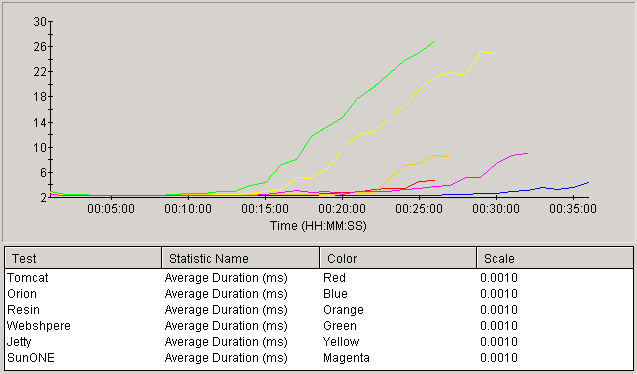
Results: Servlet & Static Resource Performance
The servers showed significantly different performance characteristics when serving static resources in addition to servlets. After adding static resources to the mix, Resin, Tomcat and Sun ONE occupy the middle ground with Orion making a strong showing. The response times of Websphere and Jetty degraded significantly earlier (and by more) than the other servers.
When analyzing the errors generated by the servers, Websphere and Jetty improved their standing by surviving longer than Tomcat and Resin (respectively) before generating errors. The Sun ONE server was finally loaded to the point of generating errors, while Orion demonstrated the best overall resilience under load.
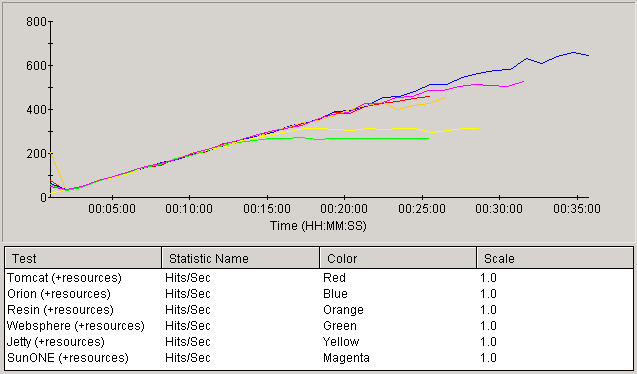
The performance in the Hits/sec category shows a wider spread when serving static resources. The best performer (Orion) served nearly double the hit-rate of the bottom of the pack (Websphere and Jetty). Tomcat and Resin were closely matched in the middle, while Sun ONE surpassed them by a narrow margin.
Analysis
And the winner is...
As stated at the outset of this report, there is no clear winner. Several servers distinguished themselves in different aspects of servlet performance. Since raw performance is only a small part of the overall value provided by these servers, you will have to weigh all the factors (performance, administration, value-added features, price) and pick the best solution for your application. I hope the information provided here will improve the quality of that decision!
Future Directions
I would like to expand this report based on feedback from the community. For starters, I look forward to measuring more of the facilities that are commonly used by servlets, such as session tracking, resource pooling and SSL. A long-duration stability-under-load test may be interesting, as well.
Version History
v0.1 - internal review (8 nov 02)
v0.2 - internal review (15 nov 02)
v1.0 - 1st public release (19 nov 02)
v1.1 - make version numbers more prominent (21 nov 02)