| Load Test Report | |
| 50 + 50 up to 300 |
Top-level Metrics
The Top-level Metrics section depicts the overall performance of the system under test using the metrics collected during the test (average page duration, pages/sec, bandwidth, etc). Charts for key summary metrics are included help determine if performance degraded during the test.
| Estimated User Capacity | at least 100 |
| Maximum Users Analyzed | 300 |
| Summary | |
| Start Time | 9:10 AM 2/11/09 |
| Duration | 12:44 |
| Completed Pages | 21,766 |
| Total hits | 85,919 |
| Peak hits/sec | 419.9 |
| Peak transfer speed | 25.0 Mbps |
| Peak cases/min | 636.0 |
| Total Pages Failed | 6,511 |
Performance Goal Analysis
In this section, each user level is analyzed for the compliance of test-level performance goals. Page-level or transaction-level goals are not included in this analysis. See the User Capacity and Performance Goal sections for a broader analysis.
Learn more about performance goals by watching the Performance Goals screencast
| User Level | Page Failure Rate |
| 50 |  |
| 100 | |
| 150 |  |
| 200 | |
| 250 | |
| 300 | |

User Level Analysis
Learn more about User Level Analysis by watching the User Level Analysis screencast
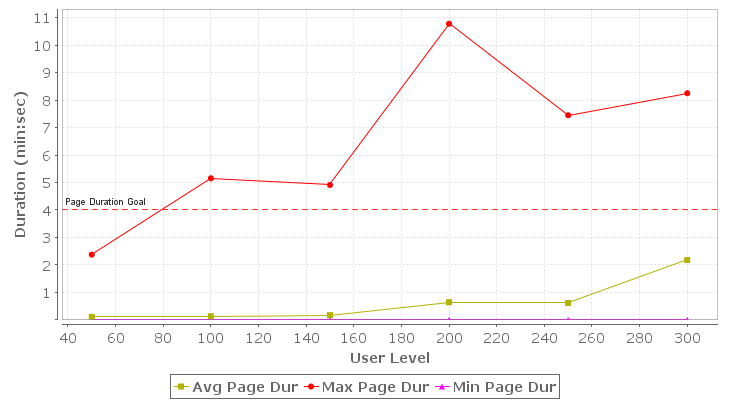
Page Duration
The Page Duration chart shows the minimum, maximum and average page duration for all pages in the test that completed during the sample periods summarized for each user level. Note that the page duration includes the time required to retrieve all resources for the page from the server. It includes network transmission time but not browser rendering time. In a well-performing system, the page durations should remain below the required limits up to or beyond the required load (number of users), subject to the performance requirements set forth for the system.
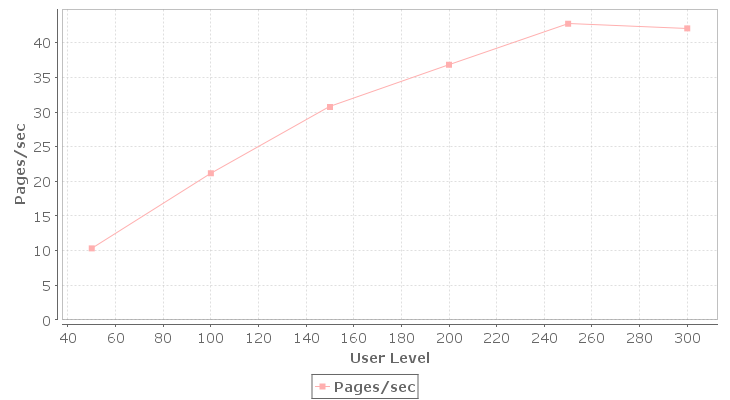
Page Completion Rate
The Page Completion Rate chart shows the total number of pages completed per second during the sample periods summarized for each user level. In a well-performing system, this number should scale linearly with the applied load (number of users).
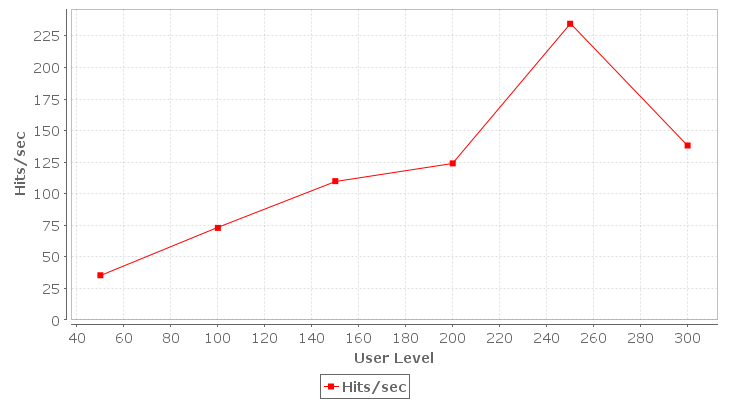
Transaction (URL) Completion Rate
The Transaction (URL) Completion Rate chart shows the total number of HTTP transactions (URLs) completed per second during the sample periods summarized for each user level. In a well-performing system, this number should scale linearly with the applied load (number of users).
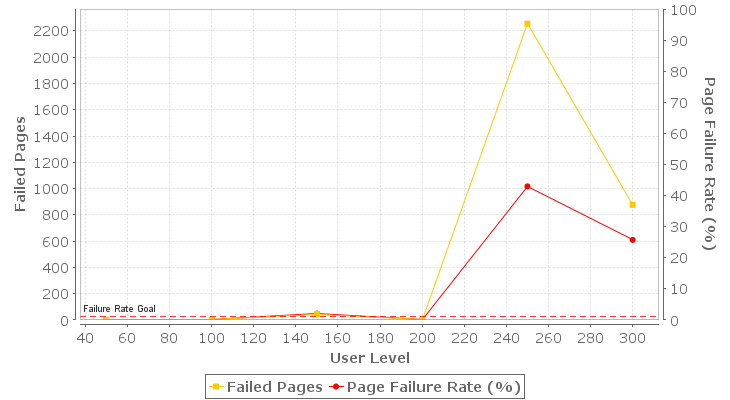
Failures
The failures section chart illustrates how the total number of page failures and the page failure rate changed throughout the test relative to the sample periods summarized for each user level. A page can fail for any number of reasons, including failures in the network and servers (web, application or database). See the Failures section of the report for details on the page failures encountered. In a well-performing system, this number should be zero.
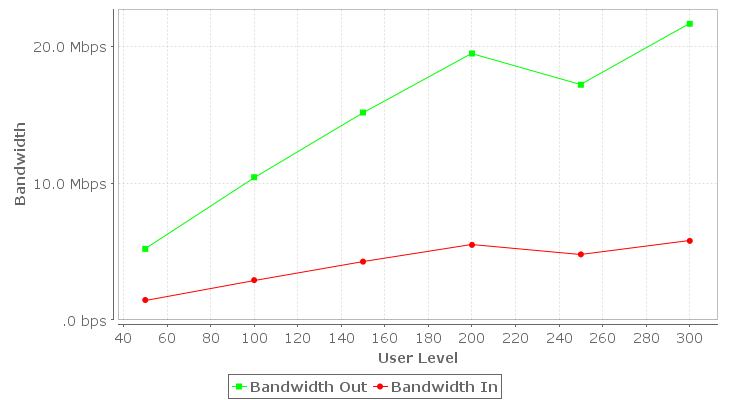
Bandwidth Consumption
The Bandwidth chart shows the total bandwidth consumed by traffic generated directly by the load test engines during the sample periods summarized for each user level. In a system that is not constrained by bandwidth, this number should scale linearly with the applied load (number of users). Note that other sources of bandwidth may be active during a test and may even be caused indirectly by the load test but may not be included in this metric. If the Advanced Server Analysis module was used to collect server metrics, refer to the Servers section of the report for more detailed data. The bandwidth consumption is described in terms of the servers; i.e. outgoing bandwidth refers to data sent by the server to the browser.
Learn more about the diagnosing bandwidth limitations by watching the Bandwidth screencast
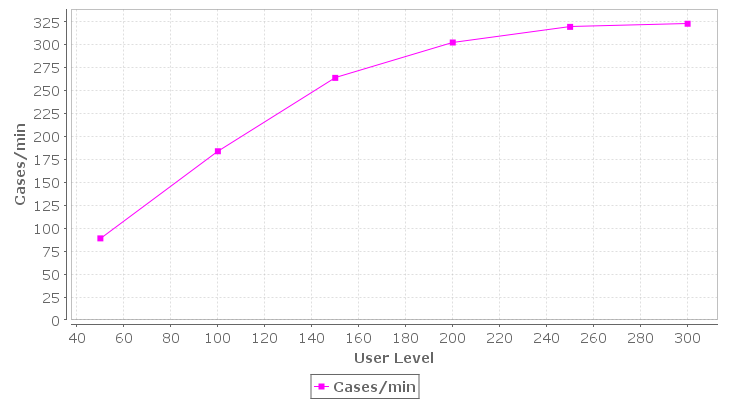
Cases/min
The Testcase Completion Rate chart shows the total number of testcases completed per minute during the sample periods summarized for each user level. In a well-performing system, this number should scale linearly with the applied load (number of users).
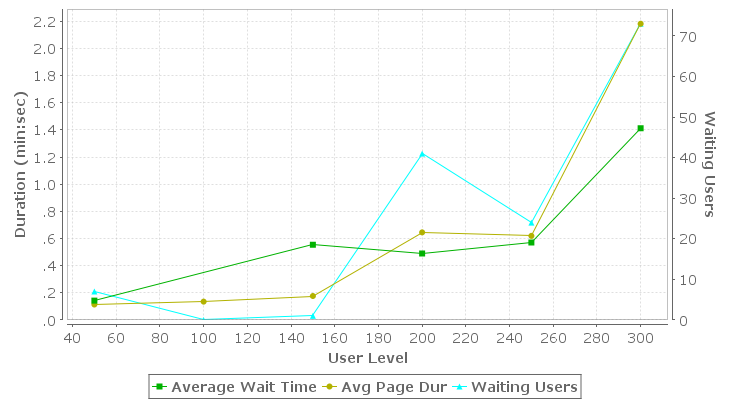
Waiting Users
The Waiting Users and Average Wait Time metrics help diagnose certain types of performance problems. For example, they can help determine what pages users have stopped on when a server becomes non-responsive. The 'Waiting Users' metric counts the number of users waiting to complete a web page at the end of the sample periods summarized for each user level. The 'Average Wait Time' describes the amount of time, on average, that each of those users has been waiting to complete the page.
Learn more about the Waiting User metrics by watching the Waiting Users screencast
Summarized by the selected user levels, this table shows some of the key metrics that reflect the performance of the test as a whole.
| User Level | Pages/sec | Page Failure Rate | Hits/sec | Bandwidth Out | Min Page Dur | Avg Page Dur | Max Page Dur | Waiting Users | Average Wait Time |
| 50 | 10.3 | .00% | 35.4 | 5.2 Mbps | .008 | .114 | 2.375 | 7 | .142 |
| 100 | 21.2 | .00% | 73.0 | 10.4 Mbps | .008 | .135 | 5.153 | 0 | |
| 150 | 30.7 | 2.05% | 110.0 | 15.2 Mbps | .008 | .176 | 4.911 | 1 | .554 |
| 200 | 36.8 | .00% | 124.0 | 19.5 Mbps | .009 | .645 | 10.772 | 41 | .489 |
| 250 | 42.7 | 42.97% | 234.6 | 17.2 Mbps | .008 | .619 | 7.444 | 24 | .570 |
| 300 | 42.1 | 25.76% | 138.1 | 21.6 Mbps | .010 | 2.181 | 8.247 | 73 | 1.412 |
Time-based Analysis
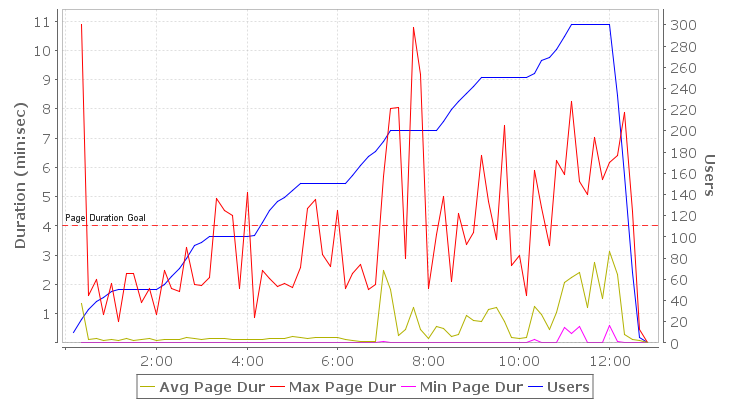
Page Duration
The Page Duration chart shows the minimum, maximum and average page duration for all pages in the test relative to the elapsed test time (sample period) in which they completed. Note that the page duration includes the time required to retrieve all resources for the page from the server. It includes network transmission time but not browser rendering time. In a well-performing system, the page durations should remain below the required limits up to or beyond the required load (number of users), subject to the performance requirements set forth for the system.
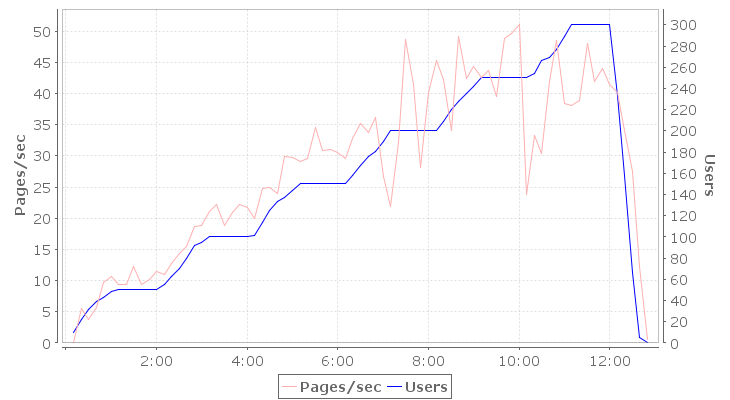
Page Completion Rate
The Page Completion Rate chart shows the total number of pages completed per second relative to the elapsed test time (sample period) in which they completed. In a well-performing system, this number should scale linearly with the applied load (number of users).
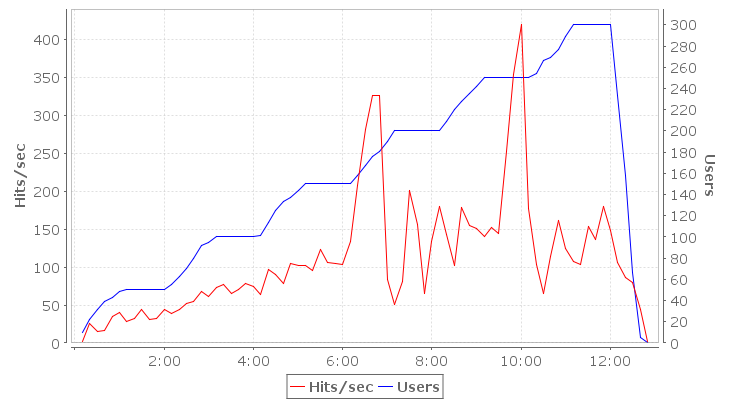
Transaction (URL) Completion Rate
The Transaction (URL) Completion Rate chart shows the total number of HTTP transactions (URLs) completed per second relative to the elapsed test time (sample period) in which they completed. In a well-performing system, this number should scale linearly with the applied load (number of users).
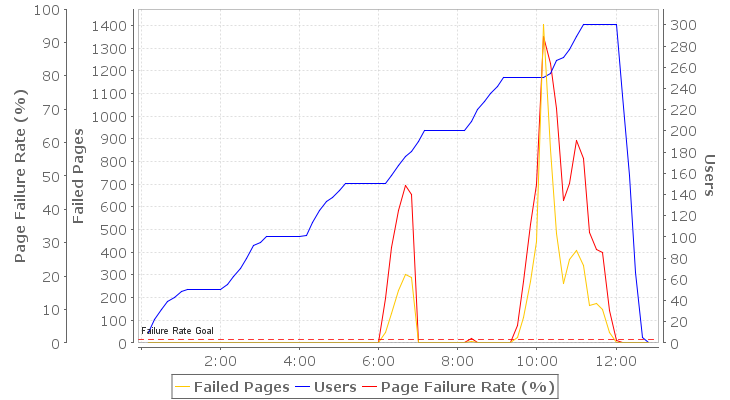
Failures
The failures section chart illustrates how the total number of page failures and the page failure rate changed throughout the test relative to the elapsed test time (sample period) in which they occurred. A page can fail for any number of reasons, including failures in the network and servers (web, application or database). See the Failures section of the report for details on the page failures encountered. In a well-performing system, this number should be zero.
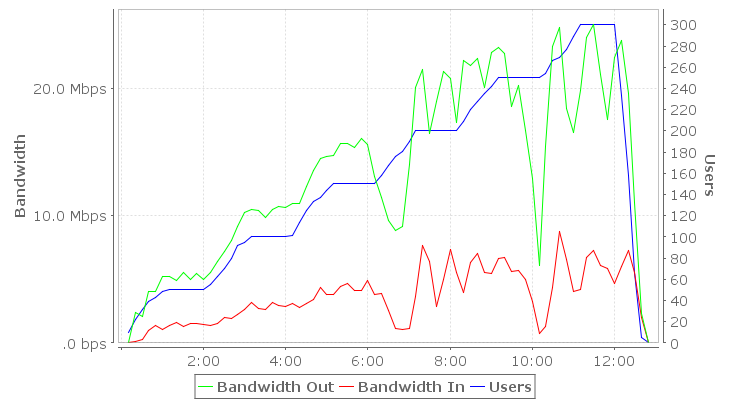
Bandwidth Consumption
The Bandwidth chart shows the total bandwidth consumed by traffic generated directly by the load test engines throughout the test relative to the elapsed test time (sample period). In a system that is not constrained by bandwidth, this number should scale linearly with the applied load (number of users). Note that other sources of bandwidth may be active during a test and may even be caused indirectly by the load test but may not be included in this metric. If the Advanced Server Analysis module was used to collect server metrics, refer to the Servers section of the report for more detailed data. The bandwidth consumption is described in terms of the servers; i.e. outgoing bandwidth refers to data sent by the server to the browser.
Learn more about the diagnosing bandwidth limitations by watching the Bandwidth screencast
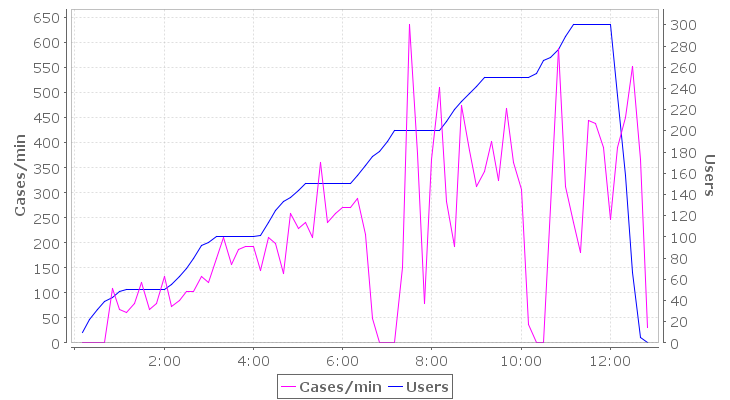
Cases/min
The Testcase Completion Rate chart shows the total number of testcases completed per minute relative to the elapsed test time (sample period) in which they completed. In a well-performing system, this number should scale linearly with the applied load (number of users).
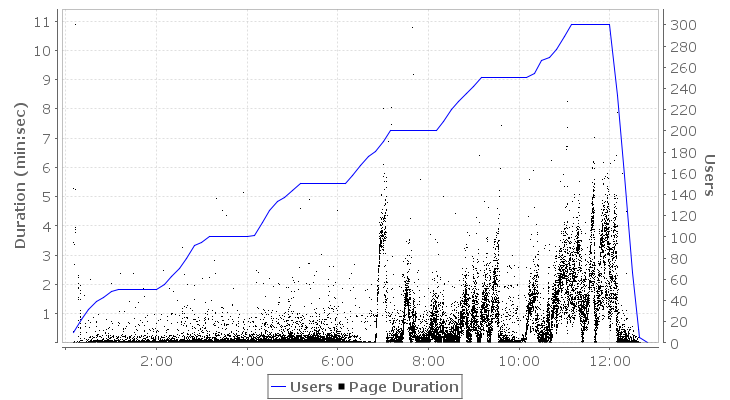
Detailed Page Durations
The Detailed Page Durations chart shows the duration of each completed page plotted as a single point on the chart. This can give a more complete picture of system performance than the min/max/avg metrics plotted above by differentiating the performance of majority of pages from the outliers.
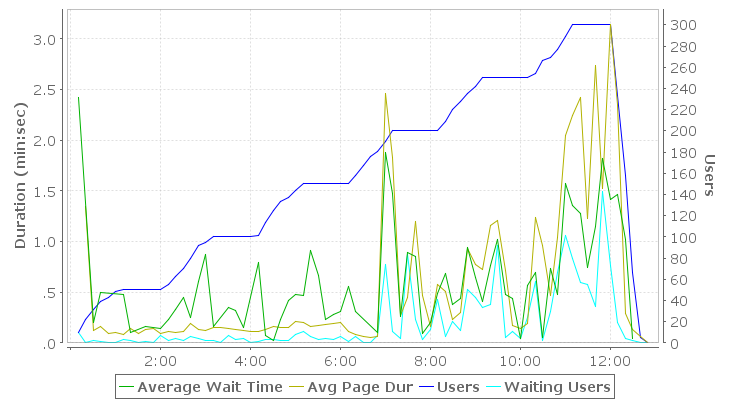
Waiting Users
The Waiting Users and Average Wait Time metrics help diagnose certain types of performance problems. For example, they can help determine what pages users have stopped on when a server becomes non-responsive. The 'Waiting Users' metric counts the number of users waiting to complete a web page at the end of the sample period. The 'Average Wait Time' describes the amount of time, on average, that each of those users has been waiting to complete the page.
Learn more about the Waiting User metrics by watching the Waiting Users screencast
Test summary metrics
Sorted by the elapsed test time, this table shows some of the key metrics that reflect the performance of the test as a whole.
| Time | Users | Pages/sec | Page Failure Rate | Hits/sec | Bandwidth Out | Min Page Dur | Avg Page Dur | Max Page Dur | Waiting Users | Average Wait Time |
| 00:00:10 | 10 | .0 | 1.8 | 6.8 kbps | 10 | 2.420 | ||||
| 00:00:20 | 22 | 5.5 | .00% | 25.6 | 2.4 Mbps | .017 | 1.345 | 10.872 | 0 | |
| 00:00:30 | 32 | 3.8 | .00% | 14.6 | 2.1 Mbps | .015 | .124 | 1.607 | 2 | .204 |
| 00:00:40 | 39 | 5.7 | .00% | 16.7 | 4.0 Mbps | .015 | .167 | 2.180 | 1 | .494 |
| 00:00:50 | 43 | 9.7 | .00% | 35.3 | 4.1 Mbps | .011 | .089 | .973 | 0 | |
| 00:01:00 | 49 | 10.6 | .00% | 40.5 | 5.2 Mbps | .009 | .103 | 2.037 | 0 | |
| 00:01:10 | 50 | 9.3 | .00% | 28.3 | 5.3 Mbps | .009 | .087 | .734 | 3 | .478 |
| 00:01:20 | 50 | 9.4 | .00% | 31.9 | 4.9 Mbps | .009 | .145 | 2.361 | 2 | .103 |
| 00:01:30 | 50 | 12.3 | .00% | 44.4 | 5.5 Mbps | .009 | .096 | 2.375 | 0 | |
| 00:01:40 | 50 | 9.4 | .00% | 30.8 | 5.0 Mbps | .008 | .133 | 1.384 | 1 | .161 |
| 00:01:50 | 50 | 10.1 | .00% | 32.9 | 5.4 Mbps | .009 | .142 | 1.873 | 0 | |
| 00:02:00 | 50 | 11.5 | .00% | 43.9 | 5.0 Mbps | .009 | .090 | .957 | 7 | .142 |
| 00:02:10 | 55 | 11.0 | .00% | 38.3 | 5.5 Mbps | .009 | .118 | 2.490 | 2 | .236 |
| 00:02:20 | 63 | 12.7 | .00% | 44.5 | 6.4 Mbps | .009 | .107 | 1.857 | 4 | .330 |
| 00:02:30 | 70 | 14.3 | .00% | 51.7 | 7.2 Mbps | .008 | .114 | 1.758 | 2 | .444 |
| 00:02:40 | 80 | 15.4 | .00% | 54.2 | 8.1 Mbps | .009 | .192 | 3.261 | 6 | .252 |
| 00:02:50 | 92 | 18.7 | .00% | 67.8 | 9.1 Mbps | .009 | .136 | 1.984 | 4 | .604 |
| 00:03:00 | 95 | 18.8 | .00% | 61.9 | 10.3 Mbps | .008 | .128 | 1.959 | 2 | .874 |
| 00:03:10 | 100 | 21.1 | .00% | 72.6 | 10.5 Mbps | .009 | .154 | 2.235 | 2 | .159 |
| 00:03:20 | 100 | 22.2 | .00% | 77.3 | 10.4 Mbps | .009 | .156 | 4.951 | 0 | |
| 00:03:30 | 100 | 18.9 | .00% | 65.1 | 9.8 Mbps | .008 | .144 | 4.513 | 7 | .355 |
| 00:03:40 | 100 | 20.9 | .00% | 70.4 | 10.5 Mbps | .008 | .129 | 4.345 | 3 | .323 |
| 00:03:50 | 100 | 22.2 | .00% | 78.3 | 10.7 Mbps | .008 | .119 | 1.878 | 4 | .153 |
| 00:04:00 | 100 | 21.7 | .00% | 74.1 | 10.7 Mbps | .008 | .115 | 5.153 | 0 | |
| 00:04:10 | 101 | 19.9 | .00% | 63.5 | 10.9 Mbps | .008 | .113 | .856 | 1 | .794 |
| 00:04:20 | 114 | 24.8 | .00% | 96.6 | 10.9 Mbps | .008 | .133 | 2.464 | 3 | .075 |
| 00:04:30 | 125 | 25.0 | .00% | 89.8 | 12.3 Mbps | .008 | .167 | 2.216 | 3 | .027 |
| 00:04:40 | 133 | 24.0 | .00% | 78.1 | 13.5 Mbps | .008 | .151 | 1.931 | 2 | .229 |
| 00:04:50 | 137 | 29.9 | .00% | 104.8 | 14.5 Mbps | .008 | .156 | 2.024 | 2 | .424 |
| 00:05:00 | 144 | 29.7 | .00% | 102.6 | 14.7 Mbps | .008 | .211 | 1.885 | 8 | .474 |
| 00:05:10 | 150 | 29.1 | .00% | 102.0 | 14.7 Mbps | .009 | .199 | 2.592 | 11 | .467 |
| 00:05:20 | 150 | 29.5 | .00% | 95.7 | 15.7 Mbps | .008 | .166 | 4.590 | 6 | .913 |
| 00:05:30 | 150 | 34.6 | .00% | 123.2 | 15.7 Mbps | .008 | .177 | 4.911 | 3 | .668 |
| 00:05:40 | 150 | 30.8 | .00% | 106.6 | 15.4 Mbps | .008 | .185 | 3.040 | 4 | .227 |
| 00:05:50 | 150 | 31.0 | .00% | 104.7 | 16.1 Mbps | .008 | .191 | 2.615 | 3 | .284 |
| 00:06:00 | 150 | 30.6 | .00% | 103.9 | 15.6 Mbps | .009 | .198 | 4.538 | 6 | .314 |
| 00:06:10 | 150 | 29.5 | 13.24% | 133.9 | 13.1 Mbps | .009 | .115 | 1.863 | 1 | .554 |
| 00:06:20 | 158 | 32.8 | 28.70% | 208.4 | 11.4 Mbps | .008 | .083 | 2.384 | 6 | .307 |
| 00:06:30 | 167 | 35.2 | 39.62% | 282.0 | 9.6 Mbps | .008 | .064 | 2.680 | 0 | |
| 00:06:40 | 176 | 33.8 | 47.19% | 326.5 | 8.8 Mbps | .009 | .056 | 1.819 | 0 | |
| 00:06:50 | 181 | 36.2 | 44.48% | 327.2 | 9.1 Mbps | .013 | .067 | 1.982 | 7 | .107 |
| 00:07:00 | 190 | 26.7 | .00% | 83.7 | 14.0 Mbps | .064 | 2.466 | 5.693 | 74 | 1.878 |
| 00:07:10 | 200 | 21.9 | .00% | 50.5 | 20.0 Mbps | .017 | 1.833 | 8.003 | 11 | 1.471 |
| 00:07:20 | 200 | 32.1 | .00% | 80.6 | 21.5 Mbps | .009 | .270 | 8.054 | 4 | .265 |
| 00:07:30 | 200 | 48.7 | .00% | 201.4 | 16.4 Mbps | .009 | .451 | 2.886 | 83 | .892 |
| 00:07:40 | 200 | 41.5 | .00% | 155.8 | 19.0 Mbps | .010 | 1.200 | 10.772 | 22 | .852 |
| 00:07:50 | 200 | 28.1 | .00% | 65.5 | 21.3 Mbps | .009 | .465 | 9.175 | 3 | .092 |
| 00:08:00 | 200 | 40.2 | .00% | 133.8 | 20.8 Mbps | .009 | .162 | 1.878 | 13 | .202 |
| 00:08:10 | 200 | 45.3 | .00% | 180.4 | 17.3 Mbps | .009 | .577 | 3.708 | 41 | .489 |
| 00:08:20 | 209 | 42.3 | 1.41% | 143.0 | 22.2 Mbps | .010 | .508 | 4.997 | 6 | .690 |
| 00:08:30 | 220 | 34.0 | .00% | 102.4 | 21.8 Mbps | .009 | .235 | 2.089 | 20 | .380 |
| 00:08:40 | 228 | 49.1 | .00% | 178.5 | 22.3 Mbps | .008 | .303 | 4.415 | 12 | .441 |
| 00:08:50 | 235 | 42.4 | .00% | 155.3 | 20.1 Mbps | .011 | .933 | 3.380 | 50 | .939 |
| 00:09:00 | 242 | 44.3 | .00% | 150.5 | 22.9 Mbps | .009 | .771 | 3.778 | 43 | .649 |
| 00:09:10 | 250 | 42.6 | .00% | 141.1 | 23.2 Mbps | .009 | .726 | 6.395 | 33 | .410 |
| 00:09:20 | 250 | 43.7 | .00% | 151.8 | 22.7 Mbps | .013 | 1.159 | 4.850 | 36 | .762 |
| 00:09:30 | 250 | 39.5 | 5.28% | 144.3 | 18.5 Mbps | .010 | 1.213 | 3.547 | 92 | 1.021 |
| 00:09:40 | 250 | 48.8 | 18.53% | 252.9 | 20.2 Mbps | .008 | .720 | 7.444 | 5 | .476 |
| 00:09:50 | 250 | 49.7 | 35.37% | 354.7 | 16.7 Mbps | .009 | .172 | 2.655 | 11 | .435 |
| 00:10:00 | 250 | 51.0 | 47.30% | 419.9 | 12.9 Mbps | .009 | .145 | 2.997 | 4 | .046 |
| 00:10:10 | 250 | 23.8 | 91.63% | 177.2 | 6.1 Mbps | .010 | .193 | 1.608 | 24 | .570 |
| 00:10:20 | 254 | 33.2 | 83.63% | 103.2 | 15.4 Mbps | .106 | 1.235 | 5.909 | 58 | .700 |
| 00:10:30 | 266 | 30.4 | 70.26% | 65.0 | 23.3 Mbps | .032 | .963 | 4.647 | 2 | .058 |
| 00:10:40 | 269 | 41.9 | 42.60% | 114.2 | 24.8 Mbps | .008 | .471 | 3.329 | 30 | .731 |
| 00:10:50 | 277 | 48.5 | 47.87% | 162.3 | 18.4 Mbps | .009 | 1.045 | 6.229 | 66 | .480 |
| 00:11:00 | 289 | 38.4 | 60.53% | 124.3 | 16.5 Mbps | .515 | 2.050 | 5.771 | 101 | 1.577 |
| 00:11:10 | 300 | 38.1 | 55.09% | 107.7 | 19.8 Mbps | .312 | 2.241 | 8.247 | 80 | 1.359 |
| 00:11:20 | 300 | 38.8 | 33.13% | 103.4 | 24.0 Mbps | .571 | 2.423 | 5.518 | 57 | 1.277 |
| 00:11:30 | 300 | 48.0 | 27.86% | 153.7 | 25.0 Mbps | .033 | 1.228 | 5.084 | 55 | .745 |
| 00:11:40 | 300 | 42.0 | 27.06% | 136.1 | 21.1 Mbps | .010 | 2.737 | 7.032 | 34 | 1.153 |
| 00:11:50 | 300 | 44.0 | 9.79% | 180.2 | 17.6 Mbps | .012 | 1.524 | 5.585 | 143 | 1.818 |
| 00:12:00 | 300 | 41.5 | .72% | 147.8 | 22.4 Mbps | .609 | 3.139 | 6.152 | 73 | 1.412 |
| 00:12:10 | 233 | 40.2 | .00% | 105.8 | 23.8 Mbps | .035 | 2.353 | 6.391 | 19 | 1.467 |
| 00:12:20 | 158 | 34.0 | .00% | 87.0 | 19.6 Mbps | .009 | .292 | 7.880 | 4 | 1.021 |
| 00:12:30 | 66 | 27.5 | .00% | 80.3 | 11.1 Mbps | .009 | .134 | 4.501 | 2 | .045 |
| 00:12:40 | 5 | 12.3 | .00% | 43.7 | 2.3 Mbps | .009 | .068 | .450 | 0 | |
| 00:12:50 | 0 | .5 | .00% | 1.5 | 20.4 kbps | .009 | .009 | .010 | 0 |