| Load Test Report | |
| 1/14/08 3:07 PM test configuration |
Server Analysis: dnn
This section provides a summary of server performance for server dnn in each group of performance metrics.
Summary: dnn
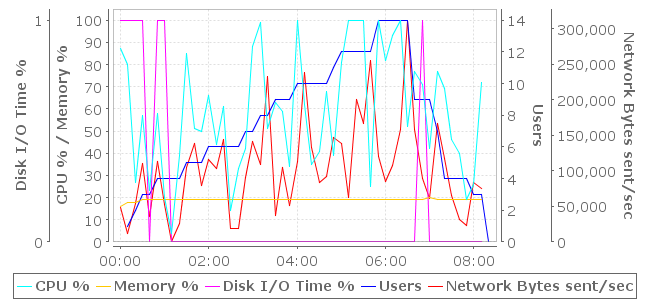
| Time | Users | CPU % | Memory % | Disk I/O Time % | Network Bytes sent/sec |
| 00:00:10 | 1 | 80% | 18% | 1% | 11.5 kBps |
| 00:00:20 | 2 | 27% | 18% | 1% | 53.0 kBps |
| 00:00:30 | 3 | 57% | 19% | 1% | 107.8 kBps |
| 00:00:40 | 3 | 23% | 19% | 0% | 34.7 kBps |
| 00:00:50 | 4 | 58% | 19% | 1% | 110.2 kBps |
| 00:01:00 | 4 | 20% | 19% | 1% | 52.0 kBps |
| 00:01:10 | 4 | 4% | 19% | 0% | 860.0 Bps |
| 00:01:20 | 4 | 39% | 19% | 0% | 24.7 kBps |
| 00:01:30 | 5 | 85% | 19% | 0% | 101.7 kBps |
| 00:01:40 | 5 | 51% | 19% | 0% | 135.2 kBps |
| 00:01:50 | 5 | 50% | 19% | 0% | 77.1 kBps |
| 00:02:00 | 6 | 66% | 19% | 0% | 113.7 kBps |
| 00:02:10 | 6 | 44% | 19% | 0% | 100.9 kBps |
| 00:02:20 | 6 | 61% | 19% | 0% | 140.3 kBps |
| 00:02:30 | 6 | 14% | 19% | 0% | 18.1 kBps |
| 00:02:40 | 6 | 33% | 19% | 0% | 18.6 kBps |
| 00:02:50 | 7 | 42% | 19% | 0% | 87.9 kBps |
| 00:03:00 | 7 | 88% | 19% | 0% | 137.3 kBps |
| 00:03:10 | 8 | 99% | 19% | 0% | 106.4 kBps |
| 00:03:20 | 8 | 51% | 19% | 0% | 227.3 kBps |
| 00:03:30 | 9 | 63% | 19% | 0% | 35.8 kBps |
| 00:03:40 | 9 | 59% | 19% | 0% | 102.7 kBps |
| 00:03:50 | 9 | 34% | 19% | 0% | 50.6 kBps |
| 00:04:00 | 10 | 100% | 19% | 0% | 111.1 kBps |
| 00:04:10 | 10 | 62% | 19% | 0% | 232.8 kBps |
| 00:04:20 | 10 | 35% | 19% | 0% | 129.9 kBps |
| 00:04:30 | 10 | 41% | 19% | 0% | 82.0 kBps |
| 00:04:40 | 10 | 68% | 19% | 0% | 89.6 kBps |
| 00:04:50 | 11 | 39% | 19% | 0% | 143.7 kBps |
| 00:05:00 | 12 | 81% | 19% | 0% | 135.6 kBps |
| 00:05:10 | 12 | 100% | 19% | 0% | 61.5 kBps |
| 00:05:20 | 12 | 100% | 19% | 0% | 196.1 kBps |
| 00:05:30 | 12 | 100% | 19% | 0% | 162.5 kBps |
| 00:05:40 | 12 | 25% | 19% | 0% | 249.5 kBps |
| 00:05:50 | 14 | 100% | 19% | 0% | 116.9 kBps |
| 00:06:00 | 14 | 82% | 19% | 0% | 83.1 kBps |
| 00:06:10 | 14 | 93% | 19% | 0% | 105.5 kBps |
| 00:06:20 | 14 | 100% | 19% | 0% | 155.0 kBps |
| 00:06:30 | 14 | 52% | 19% | 0% | 304.6 kBps |
| 00:06:40 | 9 | 77% | 19% | 0% | 154.9 kBps |
| 00:06:50 | 9 | 71% | 19% | 1% | 86.5 kBps |
| 00:07:00 | 9 | 42% | 20% | 0% | 60.1 kBps |
| 00:07:10 | 7 | 77% | 19% | 0% | 162.4 kBps |
| 00:07:20 | 4 | 69% | 19% | 0% | 114.5 kBps |
| 00:07:30 | 4 | 46% | 19% | 0% | 64.4 kBps |
| 00:07:40 | 4 | 40% | 19% | 0% | 31.1 kBps |
| 00:07:50 | 4 | 19% | 19% | 0% | 22.1 kBps |
| 00:08:00 | 3 | 26% | 19% | 0% | 81.1 kBps |
| 00:08:10 | 3 | 72% | 19% | 0% | 73.2 kBps |
| 00:08:20 | 0 |

This section cannot be printed because one or more servers monitored in the test were monitored with a demo license.
To enable printing of this section, you must obtain a full license for server monitoring -- please contact the sales staff at Web Performance.=======
Processor: dnn
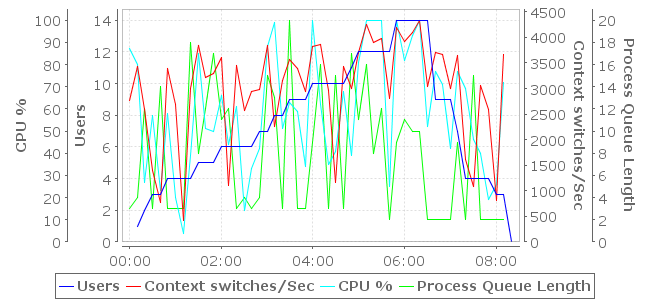
| Time | Users | Context switches/Sec | CPU % | Process Queue Length |
| 00:00:10 | 1 | 3,430 | 80% | 4 |
| 00:00:20 | 2 | 2,589 | 27% | 12 |
| 00:00:30 | 3 | 1,398 | 57% | 3 |
| 00:00:40 | 3 | 780 | 23% | 14 |
| 00:00:50 | 4 | 3,398 | 58% | 3 |
| 00:01:00 | 4 | 2,685 | 20% | 3 |
| 00:01:10 | 4 | 420 | 4% | 3 |
| 00:01:20 | 4 | 2,994 | 39% | 18 |
| 00:01:30 | 5 | 3,834 | 85% | 8 |
| 00:01:40 | 5 | 3,215 | 51% | 12 |
| 00:01:50 | 5 | 3,289 | 50% | 17 |
| 00:02:00 | 6 | 3,609 | 66% | 11 |
| 00:02:10 | 6 | 1,098 | 44% | 12 |
| 00:02:20 | 6 | 3,442 | 61% | 3 |
| 00:02:30 | 6 | 2,577 | 14% | 4 |
| 00:02:40 | 6 | 2,934 | 33% | 3 |
| 00:02:50 | 7 | 2,982 | 42% | 4 |
| 00:03:00 | 7 | 3,843 | 88% | 15 |
| 00:03:10 | 8 | 2,252 | 99% | 13 |
| 00:03:20 | 8 | 3,150 | 51% | 3 |
| 00:03:30 | 9 | 3,564 | 63% | 20 |
| 00:03:40 | 9 | 3,385 | 59% | 3 |
| 00:03:50 | 9 | 2,948 | 34% | 3 |
| 00:04:00 | 10 | 3,819 | 100% | 9 |
| 00:04:10 | 10 | 3,867 | 62% | 16 |
| 00:04:20 | 10 | 2,964 | 35% | 3 |
| 00:04:30 | 10 | 1,167 | 41% | 15 |
| 00:04:40 | 10 | 3,422 | 68% | 3 |
| 00:04:50 | 11 | 2,995 | 39% | 17 |
| 00:05:00 | 12 | 3,695 | 81% | 11 |
| 00:05:10 | 12 | 4,253 | 100% | 16 |
| 00:05:20 | 12 | 3,895 | 100% | 8 |
| 00:05:30 | 12 | 3,978 | 100% | 12 |
| 00:05:40 | 12 | 2,812 | 25% | 2 |
| 00:05:50 | 14 | 4,189 | 100% | 9 |
| 00:06:00 | 14 | 3,920 | 82% | 11 |
| 00:06:10 | 14 | 4,105 | 93% | 10 |
| 00:06:20 | 14 | 4,338 | 100% | 10 |
| 00:06:30 | 14 | 3,036 | 52% | 2 |
| 00:06:40 | 9 | 3,710 | 77% | 2 |
| 00:06:50 | 9 | 3,673 | 71% | 2 |
| 00:07:00 | 9 | 2,992 | 42% | 2 |
| 00:07:10 | 7 | 3,654 | 77% | 9 |
| 00:07:20 | 4 | 1,607 | 69% | 2 |
| 00:07:30 | 4 | 1,085 | 46% | 15 |
| 00:07:40 | 4 | 3,051 | 40% | 2 |
| 00:07:50 | 4 | 2,592 | 19% | 2 |
| 00:08:00 | 3 | 803 | 26% | 2 |
| 00:08:10 | 3 | 3,664 | 72% | 2 |
| 00:08:20 | 0 |
This section cannot be printed because one or more servers monitored in the test were monitored with a demo license.
To enable printing of this section, you must obtain a full license for server monitoring -- please contact the sales staff at Web Performance.=======
Memory: dnn
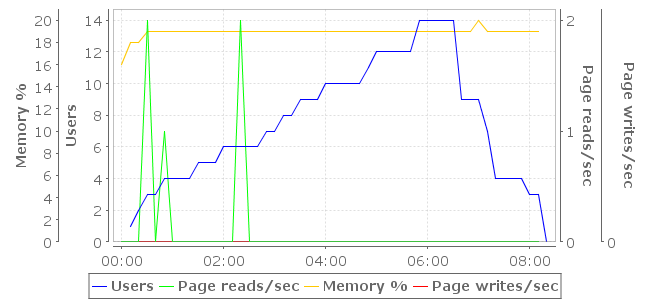
| Time | Users | Page reads/sec | Memory % | Page writes/sec |
| 00:00:10 | 1 | 0 | 18% | 0 |
| 00:00:20 | 2 | 0 | 18% | 0 |
| 00:00:30 | 3 | 2 | 19% | 0 |
| 00:00:40 | 3 | 0 | 19% | 0 |
| 00:00:50 | 4 | 1 | 19% | 0 |
| 00:01:00 | 4 | 0 | 19% | 0 |
| 00:01:10 | 4 | 0 | 19% | 0 |
| 00:01:20 | 4 | 0 | 19% | 0 |
| 00:01:30 | 5 | 0 | 19% | 0 |
| 00:01:40 | 5 | 0 | 19% | 0 |
| 00:01:50 | 5 | 0 | 19% | 0 |
| 00:02:00 | 6 | 0 | 19% | 0 |
| 00:02:10 | 6 | 0 | 19% | 0 |
| 00:02:20 | 6 | 2 | 19% | 0 |
| 00:02:30 | 6 | 0 | 19% | 0 |
| 00:02:40 | 6 | 0 | 19% | 0 |
| 00:02:50 | 7 | 0 | 19% | 0 |
| 00:03:00 | 7 | 0 | 19% | 0 |
| 00:03:10 | 8 | 0 | 19% | 0 |
| 00:03:20 | 8 | 0 | 19% | 0 |
| 00:03:30 | 9 | 0 | 19% | 0 |
| 00:03:40 | 9 | 0 | 19% | 0 |
| 00:03:50 | 9 | 0 | 19% | 0 |
| 00:04:00 | 10 | 0 | 19% | 0 |
| 00:04:10 | 10 | 0 | 19% | 0 |
| 00:04:20 | 10 | 0 | 19% | 0 |
| 00:04:30 | 10 | 0 | 19% | 0 |
| 00:04:40 | 10 | 0 | 19% | 0 |
| 00:04:50 | 11 | 0 | 19% | 0 |
| 00:05:00 | 12 | 0 | 19% | 0 |
| 00:05:10 | 12 | 0 | 19% | 0 |
| 00:05:20 | 12 | 0 | 19% | 0 |
| 00:05:30 | 12 | 0 | 19% | 0 |
| 00:05:40 | 12 | 0 | 19% | 0 |
| 00:05:50 | 14 | 0 | 19% | 0 |
| 00:06:00 | 14 | 0 | 19% | 0 |
| 00:06:10 | 14 | 0 | 19% | 0 |
| 00:06:20 | 14 | 0 | 19% | 0 |
| 00:06:30 | 14 | 0 | 19% | 0 |
| 00:06:40 | 9 | 0 | 19% | 0 |
| 00:06:50 | 9 | 0 | 19% | 0 |
| 00:07:00 | 9 | 0 | 20% | 0 |
| 00:07:10 | 7 | 0 | 19% | 0 |
| 00:07:20 | 4 | 0 | 19% | 0 |
| 00:07:30 | 4 | 0 | 19% | 0 |
| 00:07:40 | 4 | 0 | 19% | 0 |
| 00:07:50 | 4 | 0 | 19% | 0 |
| 00:08:00 | 3 | 0 | 19% | 0 |
| 00:08:10 | 3 | 0 | 19% | 0 |
| 00:08:20 | 0 |
This section cannot be printed because one or more servers monitored in the test were monitored with a demo license.
To enable printing of this section, you must obtain a full license for server monitoring -- please contact the sales staff at Web Performance.=======
Disk Utilization: dnn
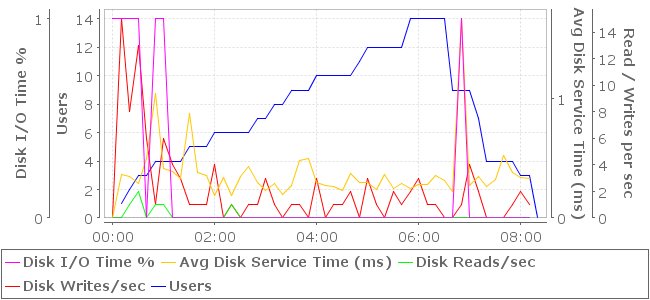
| Time | Users | Disk I/O Time % | Avg Disk Service Time (ms) | Disk Queue Length | Disk Reads/sec | Disk Writes/sec |
| 00:00:10 | 1 | 1% | .36 | 0 | 0 | 15 |
| 00:00:20 | 2 | 1% | .35 | 0 | 1 | 8 |
| 00:00:30 | 3 | 1% | .29 | 0 | 2 | 13 |
| 00:00:40 | 3 | 0% | .49 | 0 | 0 | 6 |
| 00:00:50 | 4 | 1% | 1.04 | 0 | 1 | 1 |
| 00:01:00 | 4 | 1% | .41 | 0 | 1 | 6 |
| 00:01:10 | 4 | 0% | .39 | 0 | 0 | 4 |
| 00:01:20 | 4 | 0% | .33 | 0 | 0 | 3 |
| 00:01:30 | 5 | 0% | .87 | 0 | 0 | 1 |
| 00:01:40 | 5 | 0% | .38 | 0 | 0 | 1 |
| 00:01:50 | 5 | 0% | .35 | 0 | 0 | 1 |
| 00:02:00 | 6 | 0% | .19 | 0 | 0 | 4 |
| 00:02:10 | 6 | 0% | .34 | 0 | 0 | 0 |
| 00:02:20 | 6 | 0% | .19 | 0 | 1 | 1 |
| 00:02:30 | 6 | 0% | .34 | 0 | 0 | 0 |
| 00:02:40 | 6 | 0% | .43 | 0 | 0 | 1 |
| 00:02:50 | 7 | 0% | .30 | 0 | 0 | 1 |
| 00:03:00 | 7 | 0% | .23 | 0 | 0 | 3 |
| 00:03:10 | 8 | 0% | .29 | 0 | 0 | 1 |
| 00:03:20 | 8 | 0% | .20 | 0 | 0 | 0 |
| 00:03:30 | 9 | 0% | .27 | 0 | 0 | 1 |
| 00:03:40 | 9 | 0% | .48 | 0 | 0 | 1 |
| 00:03:50 | 9 | 0% | .50 | 0 | 0 | 0 |
| 00:04:00 | 10 | 0% | .30 | 0 | 0 | 3 |
| 00:04:10 | 10 | 0% | .28 | 0 | 0 | 0 |
| 00:04:20 | 10 | 0% | .26 | 0 | 0 | 1 |
| 00:04:30 | 10 | 0% | .23 | 0 | 0 | 1 |
| 00:04:40 | 10 | 0% | .37 | 0 | 0 | 2 |
| 00:04:50 | 11 | 0% | .30 | 0 | 0 | 0 |
| 00:05:00 | 12 | 0% | .30 | 0 | 0 | 3 |
| 00:05:10 | 12 | 0% | .24 | 0 | 0 | 1 |
| 00:05:20 | 12 | 0% | .37 | 0 | 0 | 0 |
| 00:05:30 | 12 | 0% | .25 | 0 | 0 | 2 |
| 00:05:40 | 12 | 0% | .29 | 0 | 0 | 1 |
| 00:05:50 | 14 | 0% | .25 | 0 | 0 | 2 |
| 00:06:00 | 14 | 0% | .28 | 0 | 0 | 3 |
| 00:06:10 | 14 | 0% | .28 | 0 | 0 | 1 |
| 00:06:20 | 14 | 0% | .36 | 0 | 0 | 1 |
| 00:06:30 | 14 | 0% | .32 | 0 | 0 | 0 |
| 00:06:40 | 9 | 0% | .22 | 0 | 0 | 0 |
| 00:06:50 | 9 | 1% | 1.67 | 0 | 0 | 1 |
| 00:07:00 | 9 | 0% | .28 | 0 | 0 | 4 |
| 00:07:10 | 7 | 0% | .34 | 0 | 0 | 2 |
| 00:07:20 | 4 | 0% | .27 | 0 | 0 | 0 |
| 00:07:30 | 4 | 0% | .32 | 0 | 0 | 0 |
| 00:07:40 | 4 | 0% | .52 | 0 | 0 | 0 |
| 00:07:50 | 4 | 0% | .38 | 0 | 0 | 1 |
| 00:08:00 | 3 | 0% | .34 | 0 | 0 | 2 |
| 00:08:10 | 3 | 0% | .33 | 0 | 0 | 1 |
| 00:08:20 | 0 |
This section cannot be printed because one or more servers monitored in the test were monitored with a demo license.
To enable printing of this section, you must obtain a full license for server monitoring -- please contact the sales staff at Web Performance.=======
Network Bandwidth: dnn
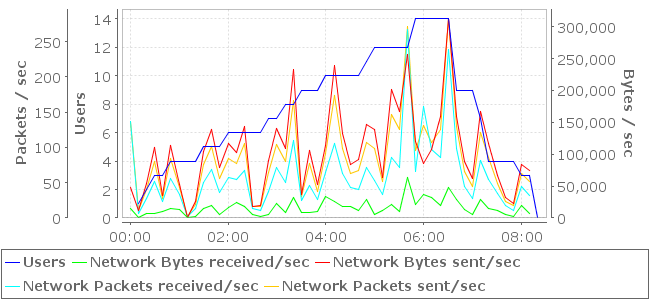
| Time | Users | Network Bytes received/sec | Network Bytes sent/sec | Network Packets received/sec | Network Packets sent/sec |
| 00:00:10 | 1 | 565.0 Bps | 11.5 kBps | 7 | 10 |
| 00:00:20 | 2 | 6.8 kBps | 53.0 kBps | 28 | 41 |
| 00:00:30 | 3 | 7.0 kBps | 107.8 kBps | 51 | 80 |
| 00:00:40 | 3 | 10.0 kBps | 34.7 kBps | 23 | 28 |
| 00:00:50 | 4 | 14.6 kBps | 110.2 kBps | 56 | 84 |
| 00:01:00 | 4 | 13.4 kBps | 52.0 kBps | 33 | 43 |
| 00:01:10 | 4 | 301.0 Bps | 860.0 Bps | 2 | 2 |
| 00:01:20 | 4 | 2.7 kBps | 24.7 kBps | 13 | 19 |
| 00:01:30 | 5 | 13.9 kBps | 101.7 kBps | 50 | 76 |
| 00:01:40 | 5 | 19.4 kBps | 135.2 kBps | 68 | 101 |
| 00:01:50 | 5 | 4.6 kBps | 77.1 kBps | 36 | 56 |
| 00:02:00 | 6 | 16.0 kBps | 113.7 kBps | 58 | 84 |
| 00:02:10 | 6 | 23.0 kBps | 100.9 kBps | 55 | 77 |
| 00:02:20 | 6 | 18.3 kBps | 140.3 kBps | 67 | 105 |
| 00:02:30 | 6 | 5.0 kBps | 18.1 kBps | 13 | 16 |
| 00:02:40 | 6 | 2.7 kBps | 18.6 kBps | 11 | 16 |
| 00:02:50 | 7 | 5.6 kBps | 87.9 kBps | 38 | 64 |
| 00:03:00 | 7 | 22.7 kBps | 137.3 kBps | 71 | 104 |
| 00:03:10 | 8 | 9.1 kBps | 106.4 kBps | 50 | 80 |
| 00:03:20 | 8 | 30.8 kBps | 227.3 kBps | 110 | 167 |
| 00:03:30 | 9 | 9.0 kBps | 35.8 kBps | 25 | 31 |
| 00:03:40 | 9 | 8.8 kBps | 102.7 kBps | 46 | 77 |
| 00:03:50 | 9 | 9.7 kBps | 50.6 kBps | 26 | 38 |
| 00:04:00 | 10 | 33.4 kBps | 111.1 kBps | 65 | 91 |
| 00:04:10 | 10 | 24.7 kBps | 232.8 kBps | 105 | 174 |
| 00:04:20 | 10 | 17.5 kBps | 129.9 kBps | 63 | 98 |
| 00:04:30 | 10 | 17.1 kBps | 82.0 kBps | 43 | 63 |
| 00:04:40 | 10 | 11.3 kBps | 89.6 kBps | 40 | 67 |
| 00:04:50 | 11 | 28.5 kBps | 143.7 kBps | 71 | 107 |
| 00:05:00 | 12 | 5.1 kBps | 135.6 kBps | 53 | 98 |
| 00:05:10 | 12 | 11.0 kBps | 61.5 kBps | 33 | 51 |
| 00:05:20 | 12 | 20.0 kBps | 196.1 kBps | 86 | 146 |
| 00:05:30 | 12 | 9.5 kBps | 162.5 kBps | 72 | 126 |
| 00:05:40 | 12 | 61.3 kBps | 249.5 kBps | 267 | 272 |
| 00:05:50 | 14 | 21.2 kBps | 116.9 kBps | 66 | 95 |
| 00:06:00 | 14 | 35.5 kBps | 83.1 kBps | 158 | 131 |
| 00:06:10 | 14 | 31.9 kBps | 105.5 kBps | 97 | 107 |
| 00:06:20 | 14 | 19.2 kBps | 155.0 kBps | 85 | 125 |
| 00:06:30 | 14 | 46.8 kBps | 304.6 kBps | 239 | 282 |
| 00:06:40 | 9 | 28.9 kBps | 154.9 kBps | 98 | 129 |
| 00:06:50 | 9 | 13.0 kBps | 86.5 kBps | 44 | 66 |
| 00:07:00 | 9 | 5.8 kBps | 60.1 kBps | 27 | 44 |
| 00:07:10 | 7 | 28.5 kBps | 162.4 kBps | 82 | 121 |
| 00:07:20 | 4 | 14.9 kBps | 114.5 kBps | 54 | 85 |
| 00:07:30 | 4 | 11.4 kBps | 64.4 kBps | 34 | 49 |
| 00:07:40 | 4 | 5.8 kBps | 31.1 kBps | 17 | 24 |
| 00:07:50 | 4 | 1.8 kBps | 22.1 kBps | 10 | 17 |
| 00:08:00 | 3 | 19.1 kBps | 81.1 kBps | 45 | 63 |
| 00:08:10 | 3 | 6.8 kBps | 73.2 kBps | 32 | 52 |
| 00:08:20 | 0 |
This section cannot be printed because one or more servers monitored in the test were monitored with a demo license.
To enable printing of this section, you must obtain a full license for server monitoring -- please contact the sales staff at Web Performance.=======
Connections: dnn
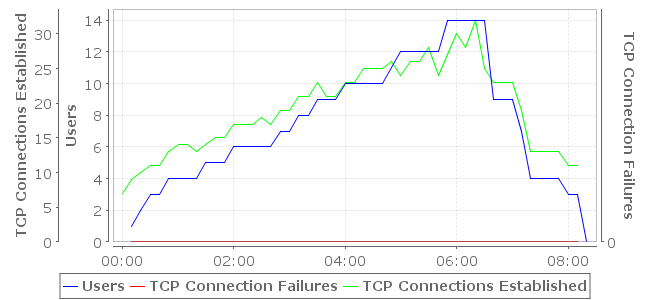
| Time | Users | TCP Connection Failures | TCP Connections Established |
| 00:00:10 | 1 | 0 | 9 |
| 00:00:20 | 2 | 0 | 10 |
| 00:00:30 | 3 | 0 | 11 |
| 00:00:40 | 3 | 0 | 11 |
| 00:00:50 | 4 | 0 | 13 |
| 00:01:00 | 4 | 0 | 14 |
| 00:01:10 | 4 | 0 | 14 |
| 00:01:20 | 4 | 0 | 13 |
| 00:01:30 | 5 | 0 | 14 |
| 00:01:40 | 5 | 0 | 15 |
| 00:01:50 | 5 | 0 | 15 |
| 00:02:00 | 6 | 0 | 17 |
| 00:02:10 | 6 | 0 | 17 |
| 00:02:20 | 6 | 0 | 17 |
| 00:02:30 | 6 | 0 | 18 |
| 00:02:40 | 6 | 0 | 17 |
| 00:02:50 | 7 | 0 | 19 |
| 00:03:00 | 7 | 0 | 19 |
| 00:03:10 | 8 | 0 | 21 |
| 00:03:20 | 8 | 0 | 21 |
| 00:03:30 | 9 | 0 | 23 |
| 00:03:40 | 9 | 0 | 21 |
| 00:03:50 | 9 | 0 | 21 |
| 00:04:00 | 10 | 0 | 23 |
| 00:04:10 | 10 | 0 | 23 |
| 00:04:20 | 10 | 0 | 25 |
| 00:04:30 | 10 | 0 | 25 |
| 00:04:40 | 10 | 0 | 25 |
| 00:04:50 | 11 | 0 | 26 |
| 00:05:00 | 12 | 0 | 24 |
| 00:05:10 | 12 | 0 | 26 |
| 00:05:20 | 12 | 0 | 26 |
| 00:05:30 | 12 | 0 | 28 |
| 00:05:40 | 12 | 0 | 24 |
| 00:05:50 | 14 | 0 | 27 |
| 00:06:00 | 14 | 0 | 30 |
| 00:06:10 | 14 | 0 | 28 |
| 00:06:20 | 14 | 0 | 32 |
| 00:06:30 | 14 | 0 | 25 |
| 00:06:40 | 9 | 0 | 23 |
| 00:06:50 | 9 | 0 | 23 |
| 00:07:00 | 9 | 0 | 23 |
| 00:07:10 | 7 | 0 | 19 |
| 00:07:20 | 4 | 0 | 13 |
| 00:07:30 | 4 | 0 | 13 |
| 00:07:40 | 4 | 0 | 13 |
| 00:07:50 | 4 | 0 | 13 |
| 00:08:00 | 3 | 0 | 11 |
| 00:08:10 | 3 | 0 | 11 |
| 00:08:20 | 0 |
This section cannot be printed because one or more servers monitored in the test were monitored with a demo license.
To enable printing of this section, you must obtain a full license for server monitoring -- please contact the sales staff at Web Performance.=======
Network Errors: dnn
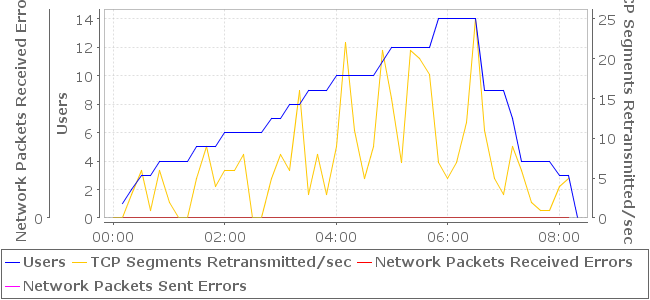
| Time | Users | Network Packets Received Errors | Network Packets Sent Errors | TCP Segments Retransmitted/sec |
| 00:00:10 | 1 | 0 | 0 | 0 |
| 00:00:20 | 2 | 0 | 0 | 3 |
| 00:00:30 | 3 | 0 | 0 | 6 |
| 00:00:40 | 3 | 0 | 0 | 1 |
| 00:00:50 | 4 | 0 | 0 | 6 |
| 00:01:00 | 4 | 0 | 0 | 2 |
| 00:01:10 | 4 | 0 | 0 | 0 |
| 00:01:20 | 4 | 0 | 0 | 0 |
| 00:01:30 | 5 | 0 | 0 | 5 |
| 00:01:40 | 5 | 0 | 0 | 9 |
| 00:01:50 | 5 | 0 | 0 | 4 |
| 00:02:00 | 6 | 0 | 0 | 6 |
| 00:02:10 | 6 | 0 | 0 | 6 |
| 00:02:20 | 6 | 0 | 0 | 8 |
| 00:02:30 | 6 | 0 | 0 | 0 |
| 00:02:40 | 6 | 0 | 0 | 0 |
| 00:02:50 | 7 | 0 | 0 | 5 |
| 00:03:00 | 7 | 0 | 0 | 8 |
| 00:03:10 | 8 | 0 | 0 | 6 |
| 00:03:20 | 8 | 0 | 0 | 16 |
| 00:03:30 | 9 | 0 | 0 | 3 |
| 00:03:40 | 9 | 0 | 0 | 8 |
| 00:03:50 | 9 | 0 | 0 | 3 |
| 00:04:00 | 10 | 0 | 0 | 9 |
| 00:04:10 | 10 | 0 | 0 | 22 |
| 00:04:20 | 10 | 0 | 0 | 11 |
| 00:04:30 | 10 | 0 | 0 | 5 |
| 00:04:40 | 10 | 0 | 0 | 9 |
| 00:04:50 | 11 | 0 | 0 | 21 |
| 00:05:00 | 12 | 0 | 0 | 15 |
| 00:05:10 | 12 | 0 | 0 | 7 |
| 00:05:20 | 12 | 0 | 0 | 21 |
| 00:05:30 | 12 | 0 | 0 | 20 |
| 00:05:40 | 12 | 0 | 0 | 18 |
| 00:05:50 | 14 | 0 | 0 | 7 |
| 00:06:00 | 14 | 0 | 0 | 5 |
| 00:06:10 | 14 | 0 | 0 | 7 |
| 00:06:20 | 14 | 0 | 0 | 12 |
| 00:06:30 | 14 | 0 | 0 | 25 |
| 00:06:40 | 9 | 0 | 0 | 11 |
| 00:06:50 | 9 | 0 | 0 | 5 |
| 00:07:00 | 9 | 0 | 0 | 3 |
| 00:07:10 | 7 | 0 | 0 | 9 |
| 00:07:20 | 4 | 0 | 0 | 6 |
| 00:07:30 | 4 | 0 | 0 | 2 |
| 00:07:40 | 4 | 0 | 0 | 1 |
| 00:07:50 | 4 | 0 | 0 | 1 |
| 00:08:00 | 3 | 0 | 0 | 4 |
| 00:08:10 | 3 | 0 | 0 | 5 |
| 00:08:20 | 0 |
This section cannot be printed because one or more servers monitored in the test were monitored with a demo license.
To enable printing of this section, you must obtain a full license for server monitoring -- please contact the sales staff at Web Performance.=======
.NET CLR Memory Usage: dnn
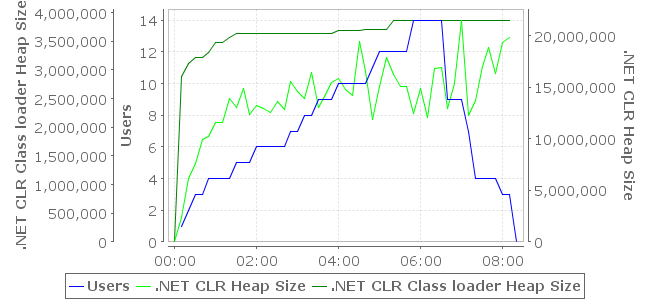
| Time | Users | .NET CLR Heap Size | .NET CLR Class loader Heap Size |
| 00:00:10 | 1 | 2.2 MB | 2.7 MB |
| 00:00:20 | 2 | 5.9 MB | 3.0 MB |
| 00:00:30 | 3 | 7.2 MB | 3.1 MB |
| 00:00:40 | 3 | 9.5 MB | 3.1 MB |
| 00:00:50 | 4 | 9.8 MB | 3.2 MB |
| 00:01:00 | 4 | 11.0 MB | 3.3 MB |
| 00:01:10 | 4 | 11.0 MB | 3.3 MB |
| 00:01:20 | 4 | 13.2 MB | 3.4 MB |
| 00:01:30 | 5 | 12.5 MB | 3.5 MB |
| 00:01:40 | 5 | 14.2 MB | 3.5 MB |
| 00:01:50 | 5 | 11.8 MB | 3.5 MB |
| 00:02:00 | 6 | 12.6 MB | 3.5 MB |
| 00:02:10 | 6 | 12.3 MB | 3.5 MB |
| 00:02:20 | 6 | 12.0 MB | 3.5 MB |
| 00:02:30 | 6 | 13.0 MB | 3.5 MB |
| 00:02:40 | 6 | 12.2 MB | 3.5 MB |
| 00:02:50 | 7 | 14.9 MB | 3.5 MB |
| 00:03:00 | 7 | 13.9 MB | 3.5 MB |
| 00:03:10 | 8 | 13.3 MB | 3.5 MB |
| 00:03:20 | 8 | 15.7 MB | 3.5 MB |
| 00:03:30 | 9 | 12.4 MB | 3.5 MB |
| 00:03:40 | 9 | 13.6 MB | 3.5 MB |
| 00:03:50 | 9 | 14.8 MB | 3.5 MB |
| 00:04:00 | 10 | 15.1 MB | 3.5 MB |
| 00:04:10 | 10 | 14.1 MB | 3.5 MB |
| 00:04:20 | 10 | 13.5 MB | 3.5 MB |
| 00:04:30 | 10 | 18.5 MB | 3.5 MB |
| 00:04:40 | 10 | 15.8 MB | 3.5 MB |
| 00:04:50 | 11 | 11.3 MB | 3.5 MB |
| 00:05:00 | 12 | 14.3 MB | 3.5 MB |
| 00:05:10 | 12 | 17.0 MB | 3.5 MB |
| 00:05:20 | 12 | 15.5 MB | 3.7 MB |
| 00:05:30 | 12 | 14.4 MB | 3.7 MB |
| 00:05:40 | 12 | 14.3 MB | 3.7 MB |
| 00:05:50 | 14 | 11.9 MB | 3.7 MB |
| 00:06:00 | 14 | 14.1 MB | 3.7 MB |
| 00:06:10 | 14 | 11.5 MB | 3.7 MB |
| 00:06:20 | 14 | 16.0 MB | 3.7 MB |
| 00:06:30 | 14 | 16.2 MB | 3.7 MB |
| 00:06:40 | 9 | 12.3 MB | 3.7 MB |
| 00:06:50 | 9 | 14.6 MB | 3.7 MB |
| 00:07:00 | 9 | 20.5 MB | 3.7 MB |
| 00:07:10 | 7 | 11.7 MB | 3.7 MB |
| 00:07:20 | 4 | 13.1 MB | 3.7 MB |
| 00:07:30 | 4 | 16.2 MB | 3.7 MB |
| 00:07:40 | 4 | 18.0 MB | 3.7 MB |
| 00:07:50 | 4 | 15.6 MB | 3.7 MB |
| 00:08:00 | 3 | 18.4 MB | 3.7 MB |
| 00:08:10 | 3 | 18.9 MB | 3.7 MB |
| 00:08:20 | 0 |
This section cannot be printed because one or more servers monitored in the test were monitored with a demo license.
To enable printing of this section, you must obtain a full license for server monitoring -- please contact the sales staff at Web Performance.=======
.NET CLR Garbage Collection: dnn
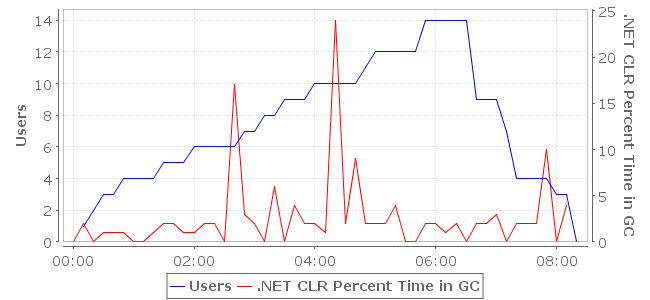
| Time | Users | .NET CLR Percent Time in GC |
| 00:00:10 | 1 | 2 |
| 00:00:20 | 2 | 0 |
| 00:00:30 | 3 | 1 |
| 00:00:40 | 3 | 1 |
| 00:00:50 | 4 | 1 |
| 00:01:00 | 4 | 0 |
| 00:01:10 | 4 | 0 |
| 00:01:20 | 4 | 1 |
| 00:01:30 | 5 | 2 |
| 00:01:40 | 5 | 2 |
| 00:01:50 | 5 | 1 |
| 00:02:00 | 6 | 1 |
| 00:02:10 | 6 | 2 |
| 00:02:20 | 6 | 2 |
| 00:02:30 | 6 | 0 |
| 00:02:40 | 6 | 17 |
| 00:02:50 | 7 | 3 |
| 00:03:00 | 7 | 2 |
| 00:03:10 | 8 | 0 |
| 00:03:20 | 8 | 6 |
| 00:03:30 | 9 | 0 |
| 00:03:40 | 9 | 4 |
| 00:03:50 | 9 | 2 |
| 00:04:00 | 10 | 2 |
| 00:04:10 | 10 | 1 |
| 00:04:20 | 10 | 24 |
| 00:04:30 | 10 | 2 |
| 00:04:40 | 10 | 9 |
| 00:04:50 | 11 | 2 |
| 00:05:00 | 12 | 2 |
| 00:05:10 | 12 | 2 |
| 00:05:20 | 12 | 4 |
| 00:05:30 | 12 | 0 |
| 00:05:40 | 12 | 0 |
| 00:05:50 | 14 | 2 |
| 00:06:00 | 14 | 2 |
| 00:06:10 | 14 | 1 |
| 00:06:20 | 14 | 2 |
| 00:06:30 | 14 | 0 |
| 00:06:40 | 9 | 2 |
| 00:06:50 | 9 | 2 |
| 00:07:00 | 9 | 3 |
| 00:07:10 | 7 | 0 |
| 00:07:20 | 4 | 2 |
| 00:07:30 | 4 | 2 |
| 00:07:40 | 4 | 2 |
| 00:07:50 | 4 | 10 |
| 00:08:00 | 3 | 0 |
| 00:08:10 | 3 | 4 |
| 00:08:20 | 0 |
This section cannot be printed because one or more servers monitored in the test were monitored with a demo license.
To enable printing of this section, you must obtain a full license for server monitoring -- please contact the sales staff at Web Performance.=======
.NET CLR Errors: dnn
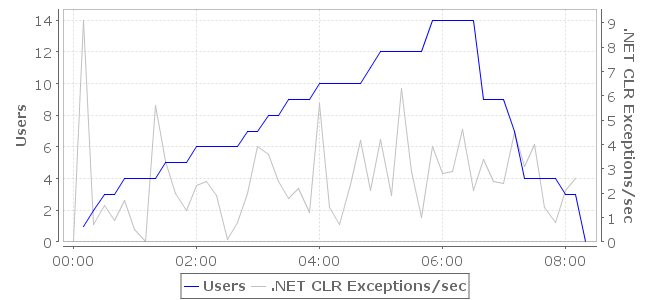
| Time | Users | .NET CLR Exceptions/sec |
| 00:00:10 | 1 | 9.11 |
| 00:00:20 | 2 | 0.70 |
| 00:00:30 | 3 | 1.50 |
| 00:00:40 | 3 | 0.90 |
| 00:00:50 | 4 | 1.70 |
| 00:01:00 | 4 | 0.50 |
| 00:01:10 | 4 | 0.00 |
| 00:01:20 | 4 | 5.60 |
| 00:01:30 | 5 | 3.29 |
| 00:01:40 | 5 | 2.00 |
| 00:01:50 | 5 | 1.30 |
| 00:02:00 | 6 | 2.30 |
| 00:02:10 | 6 | 2.50 |
| 00:02:20 | 6 | 1.90 |
| 00:02:30 | 6 | 0.10 |
| 00:02:40 | 6 | 0.80 |
| 00:02:50 | 7 | 2.00 |
| 00:03:00 | 7 | 3.91 |
| 00:03:10 | 8 | 3.60 |
| 00:03:20 | 8 | 2.50 |
| 00:03:30 | 9 | 1.80 |
| 00:03:40 | 9 | 2.20 |
| 00:03:50 | 9 | 1.20 |
| 00:04:00 | 10 | 5.67 |
| 00:04:10 | 10 | 1.43 |
| 00:04:20 | 10 | 0.70 |
| 00:04:30 | 10 | 2.37 |
| 00:04:40 | 10 | 4.15 |
| 00:04:50 | 11 | 2.10 |
| 00:05:00 | 12 | 4.20 |
| 00:05:10 | 12 | 1.90 |
| 00:05:20 | 12 | 6.29 |
| 00:05:30 | 12 | 2.90 |
| 00:05:40 | 12 | 1.00 |
| 00:05:50 | 14 | 3.90 |
| 00:06:00 | 14 | 2.80 |
| 00:06:10 | 14 | 2.90 |
| 00:06:20 | 14 | 4.60 |
| 00:06:30 | 14 | 2.10 |
| 00:06:40 | 9 | 3.40 |
| 00:06:50 | 9 | 2.50 |
| 00:07:00 | 9 | 2.40 |
| 00:07:10 | 7 | 4.50 |
| 00:07:20 | 4 | 3.10 |
| 00:07:30 | 4 | 4.00 |
| 00:07:40 | 4 | 1.40 |
| 00:07:50 | 4 | 0.80 |
| 00:08:00 | 3 | 2.10 |
| 00:08:10 | 3 | 2.60 |
| 00:08:20 | 0 |
This section cannot be printed because one or more servers monitored in the test were monitored with a demo license.
To enable printing of this section, you must obtain a full license for server monitoring -- please contact the sales staff at Web Performance.=======
.NET CLR Locks: dnn
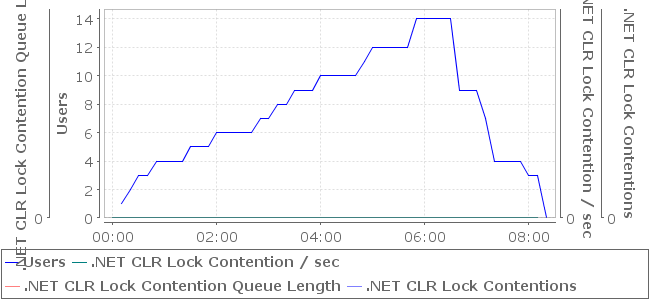
| Time | Users | .NET CLR Lock Contention / sec | .NET CLR Lock Contention Queue Length | .NET CLR Lock Contentions |
| 00:00:10 | 1 | 0.00 | 0 | 0 |
| 00:00:20 | 2 | 0.00 | 0 | 0 |
| 00:00:30 | 3 | 0.00 | 0 | 0 |
| 00:00:40 | 3 | 0.00 | 0 | 0 |
| 00:00:50 | 4 | 0.00 | 0 | 0 |
| 00:01:00 | 4 | 0.00 | 0 | 0 |
| 00:01:10 | 4 | 0.00 | 0 | 0 |
| 00:01:20 | 4 | 0.00 | 0 | 0 |
| 00:01:30 | 5 | 0.00 | 0 | 0 |
| 00:01:40 | 5 | 0.00 | 0 | 0 |
| 00:01:50 | 5 | 0.00 | 0 | 0 |
| 00:02:00 | 6 | 0.00 | 0 | 0 |
| 00:02:10 | 6 | 0.00 | 0 | 0 |
| 00:02:20 | 6 | 0.00 | 0 | 0 |
| 00:02:30 | 6 | 0.00 | 0 | 0 |
| 00:02:40 | 6 | 0.00 | 0 | 0 |
| 00:02:50 | 7 | 0.00 | 0 | 0 |
| 00:03:00 | 7 | 0.00 | 0 | 0 |
| 00:03:10 | 8 | 0.00 | 0 | 0 |
| 00:03:20 | 8 | 0.00 | 0 | 0 |
| 00:03:30 | 9 | 0.00 | 0 | 0 |
| 00:03:40 | 9 | 0.00 | 0 | 0 |
| 00:03:50 | 9 | 0.00 | 0 | 0 |
| 00:04:00 | 10 | 0.00 | 0 | 0 |
| 00:04:10 | 10 | 0.00 | 0 | 0 |
| 00:04:20 | 10 | 0.00 | 0 | 0 |
| 00:04:30 | 10 | 0.00 | 0 | 0 |
| 00:04:40 | 10 | 0.00 | 0 | 0 |
| 00:04:50 | 11 | 0.00 | 0 | 0 |
| 00:05:00 | 12 | 0.00 | 0 | 0 |
| 00:05:10 | 12 | 0.00 | 0 | 0 |
| 00:05:20 | 12 | 0.00 | 0 | 0 |
| 00:05:30 | 12 | 0.00 | 0 | 0 |
| 00:05:40 | 12 | 0.00 | 0 | 0 |
| 00:05:50 | 14 | 0.00 | 0 | 0 |
| 00:06:00 | 14 | 0.00 | 0 | 0 |
| 00:06:10 | 14 | 0.00 | 0 | 0 |
| 00:06:20 | 14 | 0.00 | 0 | 0 |
| 00:06:30 | 14 | 0.00 | 0 | 0 |
| 00:06:40 | 9 | 0.00 | 0 | 0 |
| 00:06:50 | 9 | 0.00 | 0 | 0 |
| 00:07:00 | 9 | 0.00 | 0 | 0 |
| 00:07:10 | 7 | 0.00 | 0 | 0 |
| 00:07:20 | 4 | 0.00 | 0 | 0 |
| 00:07:30 | 4 | 0.00 | 0 | 0 |
| 00:07:40 | 4 | 0.00 | 0 | 0 |
| 00:07:50 | 4 | 0.00 | 0 | 0 |
| 00:08:00 | 3 | 0.00 | 0 | 0 |
| 00:08:10 | 3 | 0.00 | 0 | 0 |
| 00:08:20 | 0 |
This section cannot be printed because one or more servers monitored in the test were monitored with a demo license.
To enable printing of this section, you must obtain a full license for server monitoring -- please contact the sales staff at Web Performance.=======
.NET CLR Threads: dnn
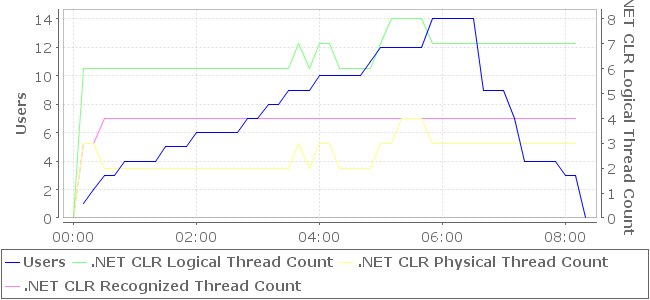
| Time | Users | .NET CLR Logical Thread Count | .NET CLR Physical Thread Count | .NET CLR Recognized Thread Count |
| 00:00:10 | 1 | 6 | 3 | 3 |
| 00:00:20 | 2 | 6 | 3 | 3 |
| 00:00:30 | 3 | 6 | 2 | 4 |
| 00:00:40 | 3 | 6 | 2 | 4 |
| 00:00:50 | 4 | 6 | 2 | 4 |
| 00:01:00 | 4 | 6 | 2 | 4 |
| 00:01:10 | 4 | 6 | 2 | 4 |
| 00:01:20 | 4 | 6 | 2 | 4 |
| 00:01:30 | 5 | 6 | 2 | 4 |
| 00:01:40 | 5 | 6 | 2 | 4 |
| 00:01:50 | 5 | 6 | 2 | 4 |
| 00:02:00 | 6 | 6 | 2 | 4 |
| 00:02:10 | 6 | 6 | 2 | 4 |
| 00:02:20 | 6 | 6 | 2 | 4 |
| 00:02:30 | 6 | 6 | 2 | 4 |
| 00:02:40 | 6 | 6 | 2 | 4 |
| 00:02:50 | 7 | 6 | 2 | 4 |
| 00:03:00 | 7 | 6 | 2 | 4 |
| 00:03:10 | 8 | 6 | 2 | 4 |
| 00:03:20 | 8 | 6 | 2 | 4 |
| 00:03:30 | 9 | 6 | 2 | 4 |
| 00:03:40 | 9 | 7 | 3 | 4 |
| 00:03:50 | 9 | 6 | 2 | 4 |
| 00:04:00 | 10 | 7 | 3 | 4 |
| 00:04:10 | 10 | 7 | 3 | 4 |
| 00:04:20 | 10 | 6 | 2 | 4 |
| 00:04:30 | 10 | 6 | 2 | 4 |
| 00:04:40 | 10 | 6 | 2 | 4 |
| 00:04:50 | 11 | 6 | 2 | 4 |
| 00:05:00 | 12 | 7 | 3 | 4 |
| 00:05:10 | 12 | 8 | 3 | 4 |
| 00:05:20 | 12 | 8 | 4 | 4 |
| 00:05:30 | 12 | 8 | 4 | 4 |
| 00:05:40 | 12 | 8 | 4 | 4 |
| 00:05:50 | 14 | 7 | 3 | 4 |
| 00:06:00 | 14 | 7 | 3 | 4 |
| 00:06:10 | 14 | 7 | 3 | 4 |
| 00:06:20 | 14 | 7 | 3 | 4 |
| 00:06:30 | 14 | 7 | 3 | 4 |
| 00:06:40 | 9 | 7 | 3 | 4 |
| 00:06:50 | 9 | 7 | 3 | 4 |
| 00:07:00 | 9 | 7 | 3 | 4 |
| 00:07:10 | 7 | 7 | 3 | 4 |
| 00:07:20 | 4 | 7 | 3 | 4 |
| 00:07:30 | 4 | 7 | 3 | 4 |
| 00:07:40 | 4 | 7 | 3 | 4 |
| 00:07:50 | 4 | 7 | 3 | 4 |
| 00:08:00 | 3 | 7 | 3 | 4 |
| 00:08:10 | 3 | 7 | 3 | 4 |
| 00:08:20 | 0 |
This section cannot be printed because one or more servers monitored in the test were monitored with a demo license.
To enable printing of this section, you must obtain a full license for server monitoring -- please contact the sales staff at Web Performance.=======
.NET CLR Loading: dnn
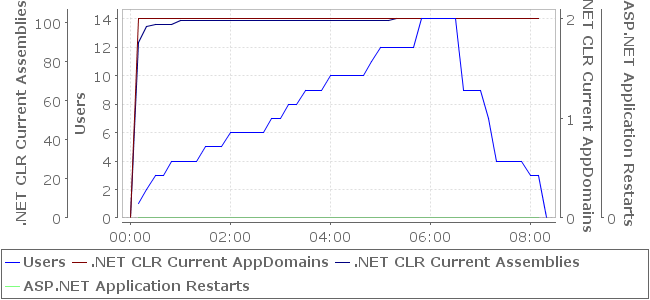
| Time | Users | .NET CLR Current AppDomains | .NET CLR Current Assemblies | ASP.NET Application Restarts |
| 00:00:10 | 1 | 2 | 90 | 0 |
| 00:00:20 | 2 | 2 | 98 | 0 |
| 00:00:30 | 3 | 2 | 99 | 0 |
| 00:00:40 | 3 | 2 | 99 | 0 |
| 00:00:50 | 4 | 2 | 99 | 0 |
| 00:01:00 | 4 | 2 | 101 | 0 |
| 00:01:10 | 4 | 2 | 101 | 0 |
| 00:01:20 | 4 | 2 | 101 | 0 |
| 00:01:30 | 5 | 2 | 101 | 0 |
| 00:01:40 | 5 | 2 | 101 | 0 |
| 00:01:50 | 5 | 2 | 101 | 0 |
| 00:02:00 | 6 | 2 | 101 | 0 |
| 00:02:10 | 6 | 2 | 101 | 0 |
| 00:02:20 | 6 | 2 | 101 | 0 |
| 00:02:30 | 6 | 2 | 101 | 0 |
| 00:02:40 | 6 | 2 | 101 | 0 |
| 00:02:50 | 7 | 2 | 101 | 0 |
| 00:03:00 | 7 | 2 | 101 | 0 |
| 00:03:10 | 8 | 2 | 101 | 0 |
| 00:03:20 | 8 | 2 | 101 | 0 |
| 00:03:30 | 9 | 2 | 101 | 0 |
| 00:03:40 | 9 | 2 | 101 | 0 |
| 00:03:50 | 9 | 2 | 101 | 0 |
| 00:04:00 | 10 | 2 | 101 | 0 |
| 00:04:10 | 10 | 2 | 101 | 0 |
| 00:04:20 | 10 | 2 | 101 | 0 |
| 00:04:30 | 10 | 2 | 101 | 0 |
| 00:04:40 | 10 | 2 | 101 | 0 |
| 00:04:50 | 11 | 2 | 101 | 0 |
| 00:05:00 | 12 | 2 | 101 | 0 |
| 00:05:10 | 12 | 2 | 101 | 0 |
| 00:05:20 | 12 | 2 | 102 | 0 |
| 00:05:30 | 12 | 2 | 102 | 0 |
| 00:05:40 | 12 | 2 | 102 | 0 |
| 00:05:50 | 14 | 2 | 102 | 0 |
| 00:06:00 | 14 | 2 | 102 | 0 |
| 00:06:10 | 14 | 2 | 102 | 0 |
| 00:06:20 | 14 | 2 | 102 | 0 |
| 00:06:30 | 14 | 2 | 102 | 0 |
| 00:06:40 | 9 | 2 | 102 | 0 |
| 00:06:50 | 9 | 2 | 102 | 0 |
| 00:07:00 | 9 | 2 | 102 | 0 |
| 00:07:10 | 7 | 2 | 102 | 0 |
| 00:07:20 | 4 | 2 | 102 | 0 |
| 00:07:30 | 4 | 2 | 102 | 0 |
| 00:07:40 | 4 | 2 | 102 | 0 |
| 00:07:50 | 4 | 2 | 102 | 0 |
| 00:08:00 | 3 | 2 | 102 | 0 |
| 00:08:10 | 3 | 2 | 102 | 0 |
| 00:08:20 | 0 |
This section cannot be printed because one or more servers monitored in the test were monitored with a demo license.
To enable printing of this section, you must obtain a full license for server monitoring -- please contact the sales staff at Web Performance.=======
ASP.NET Request Execution: dnn
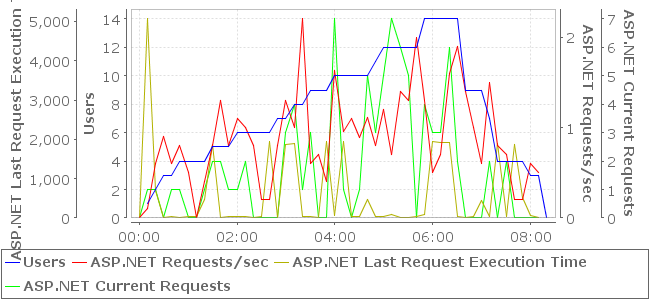
| Time | Users | ASP.NET Requests/sec | ASP.NET Last Request Execution Time | ASP.NET Current Requests |
| 00:00:10 | 1 | 0.1 | 00:05.062 | 1 |
| 00:00:20 | 2 | 0.6 | 00:00.687 | 1 |
| 00:00:30 | 3 | 0.9 | 00:00.000 | 0 |
| 00:00:40 | 3 | 0.6 | 00:00.046 | 1 |
| 00:00:50 | 4 | 0.8 | 00:00.000 | 1 |
| 00:01:00 | 4 | 0.5 | 00:00.046 | 0 |
| 00:01:10 | 4 | 0.0 | 00:00.046 | 0 |
| 00:01:20 | 4 | 0.4 | 00:00.468 | 1 |
| 00:01:30 | 5 | 0.8 | 00:01.859 | 2 |
| 00:01:40 | 5 | 1.3 | 00:00.015 | 2 |
| 00:01:50 | 5 | 0.8 | 00:00.031 | 1 |
| 00:02:00 | 6 | 1.1 | 00:00.031 | 1 |
| 00:02:10 | 6 | 1.0 | 00:00.046 | 2 |
| 00:02:20 | 6 | 0.8 | 00:00.000 | 0 |
| 00:02:30 | 6 | 0.2 | 00:00.031 | 0 |
| 00:02:40 | 6 | 0.2 | 00:01.953 | 0 |
| 00:02:50 | 7 | 0.8 | 00:00.000 | 0 |
| 00:03:00 | 7 | 1.3 | 00:01.859 | 3 |
| 00:03:10 | 8 | 1.0 | 00:01.890 | 4 |
| 00:03:20 | 8 | 2.2 | 00:00.046 | 1 |
| 00:03:30 | 9 | 0.6 | 00:00.031 | 3 |
| 00:03:40 | 9 | 0.7 | 00:00.000 | 0 |
| 00:03:50 | 9 | 0.4 | 00:01.937 | 0 |
| 00:04:00 | 10 | 1.6 | 00:00.062 | 7 |
| 00:04:10 | 10 | 1.0 | 00:01.953 | 1 |
| 00:04:20 | 10 | 1.1 | 00:00.031 | 0 |
| 00:04:30 | 10 | 0.9 | 00:00.046 | 1 |
| 00:04:40 | 10 | 1.1 | 00:00.468 | 5 |
| 00:04:50 | 11 | 0.8 | 00:00.031 | 3 |
| 00:05:00 | 12 | 1.2 | 00:00.031 | 5 |
| 00:05:10 | 12 | 0.7 | 00:00.093 | 7 |
| 00:05:20 | 12 | 1.4 | 00:00.000 | 6 |
| 00:05:30 | 12 | 1.3 | 00:00.000 | 5 |
| 00:05:40 | 12 | 2.0 | 00:00.046 | 0 |
| 00:05:50 | 14 | 1.3 | 00:00.078 | 4 |
| 00:06:00 | 14 | 0.5 | 00:01.937 | 3 |
| 00:06:10 | 14 | 0.7 | 00:01.921 | 3 |
| 00:06:20 | 14 | 1.6 | 00:01.921 | 6 |
| 00:06:30 | 14 | 1.9 | 00:00.031 | 2 |
| 00:06:40 | 9 | 1.4 | 00:00.000 | 0 |
| 00:06:50 | 9 | 1.0 | 00:00.031 | 0 |
| 00:07:00 | 9 | 0.6 | 00:00.453 | 0 |
| 00:07:10 | 7 | 1.5 | 00:00.031 | 2 |
| 00:07:20 | 4 | 0.8 | 00:01.890 | 0 |
| 00:07:30 | 4 | 0.7 | 00:00.031 | 2 |
| 00:07:40 | 4 | 0.2 | 00:01.875 | 0 |
| 00:07:50 | 4 | 0.2 | 00:00.531 | 0 |
| 00:08:00 | 3 | 0.6 | 00:00.062 | 0 |
| 00:08:10 | 3 | 0.5 | 00:00.015 | 0 |
| 00:08:20 | 0 |
This section cannot be printed because one or more servers monitored in the test were monitored with a demo license.
To enable printing of this section, you must obtain a full license for server monitoring -- please contact the sales staff at Web Performance.=======
ASP.NET Request Queue: dnn
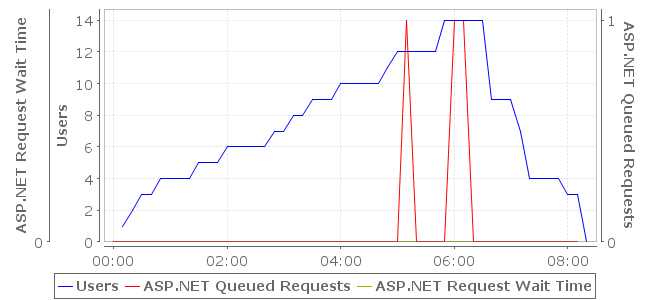
| Time | Users | ASP.NET Queued Requests | ASP.NET Request Wait Time |
| 00:00:10 | 1 | 0 | 00:00.000 |
| 00:00:20 | 2 | 0 | 00:00.000 |
| 00:00:30 | 3 | 0 | 00:00.000 |
| 00:00:40 | 3 | 0 | 00:00.000 |
| 00:00:50 | 4 | 0 | 00:00.000 |
| 00:01:00 | 4 | 0 | 00:00.000 |
| 00:01:10 | 4 | 0 | 00:00.000 |
| 00:01:20 | 4 | 0 | 00:00.000 |
| 00:01:30 | 5 | 0 | 00:00.000 |
| 00:01:40 | 5 | 0 | 00:00.000 |
| 00:01:50 | 5 | 0 | 00:00.000 |
| 00:02:00 | 6 | 0 | 00:00.000 |
| 00:02:10 | 6 | 0 | 00:00.000 |
| 00:02:20 | 6 | 0 | 00:00.000 |
| 00:02:30 | 6 | 0 | 00:00.000 |
| 00:02:40 | 6 | 0 | 00:00.000 |
| 00:02:50 | 7 | 0 | 00:00.000 |
| 00:03:00 | 7 | 0 | 00:00.000 |
| 00:03:10 | 8 | 0 | 00:00.000 |
| 00:03:20 | 8 | 0 | 00:00.000 |
| 00:03:30 | 9 | 0 | 00:00.000 |
| 00:03:40 | 9 | 0 | 00:00.000 |
| 00:03:50 | 9 | 0 | 00:00.000 |
| 00:04:00 | 10 | 0 | 00:00.000 |
| 00:04:10 | 10 | 0 | 00:00.000 |
| 00:04:20 | 10 | 0 | 00:00.000 |
| 00:04:30 | 10 | 0 | 00:00.000 |
| 00:04:40 | 10 | 0 | 00:00.000 |
| 00:04:50 | 11 | 0 | 00:00.000 |
| 00:05:00 | 12 | 0 | 00:00.000 |
| 00:05:10 | 12 | 1 | 00:00.000 |
| 00:05:20 | 12 | 0 | 00:00.000 |
| 00:05:30 | 12 | 0 | 00:00.000 |
| 00:05:40 | 12 | 0 | 00:00.000 |
| 00:05:50 | 14 | 0 | 00:00.000 |
| 00:06:00 | 14 | 1 | 00:00.000 |
| 00:06:10 | 14 | 1 | 00:00.000 |
| 00:06:20 | 14 | 0 | 00:00.000 |
| 00:06:30 | 14 | 0 | 00:00.000 |
| 00:06:40 | 9 | 0 | 00:00.000 |
| 00:06:50 | 9 | 0 | 00:00.000 |
| 00:07:00 | 9 | 0 | 00:00.000 |
| 00:07:10 | 7 | 0 | 00:00.000 |
| 00:07:20 | 4 | 0 | 00:00.000 |
| 00:07:30 | 4 | 0 | 00:00.000 |
| 00:07:40 | 4 | 0 | 00:00.000 |
| 00:07:50 | 4 | 0 | 00:00.000 |
| 00:08:00 | 3 | 0 | 00:00.000 |
| 00:08:10 | 3 | 0 | 00:00.000 |
| 00:08:20 | 0 |
This section cannot be printed because one or more servers monitored in the test were monitored with a demo license.
To enable printing of this section, you must obtain a full license for server monitoring -- please contact the sales staff at Web Performance.=======
ASP.NET Cache: dnn
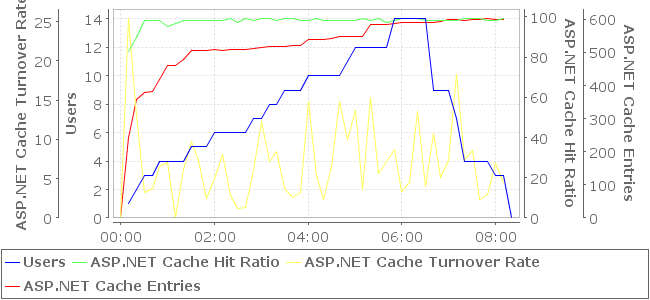
| Time | Users | ASP.NET Cache Hit Ratio | ASP.NET Cache Turnover Rate | ASP.NET Cache Entries |
| 00:00:10 | 1 | 83% | 25.3 | 243 |
| 00:00:20 | 2 | 90% | 13.0 | 359 |
| 00:00:30 | 3 | 98% | 3.3 | 380 |
| 00:00:40 | 3 | 98% | 3.7 | 381 |
| 00:00:50 | 4 | 98% | 6.6 | 419 |
| 00:01:00 | 4 | 95% | 7.0 | 459 |
| 00:01:10 | 4 | 0.0 | 459 | |
| 00:01:20 | 4 | 98% | 6.2 | 479 |
| 00:01:30 | 5 | 98% | 9.7 | 506 |
| 00:01:40 | 5 | 98% | 7.3 | 505 |
| 00:01:50 | 5 | 98% | 2.5 | 506 |
| 00:02:00 | 6 | 98% | 5.0 | 508 |
| 00:02:10 | 6 | 98% | 8.1 | 507 |
| 00:02:20 | 6 | 99% | 2.9 | 508 |
| 00:02:30 | 6 | 97% | 1.2 | 508 |
| 00:02:40 | 6 | 99% | 1.3 | 509 |
| 00:02:50 | 7 | 98% | 6.0 | 513 |
| 00:03:00 | 7 | 99% | 12.2 | 515 |
| 00:03:10 | 8 | 99% | 7.2 | 517 |
| 00:03:20 | 8 | 98% | 8.4 | 517 |
| 00:03:30 | 9 | 99% | 3.8 | 519 |
| 00:03:40 | 9 | 99% | 2.6 | 521 |
| 00:03:50 | 9 | 98% | 3.2 | 521 |
| 00:04:00 | 10 | 98% | 14.9 | 540 |
| 00:04:10 | 10 | 99% | 5.4 | 539 |
| 00:04:20 | 10 | 98% | 2.4 | 539 |
| 00:04:30 | 10 | 98% | 6.5 | 541 |
| 00:04:40 | 10 | 98% | 14.9 | 548 |
| 00:04:50 | 11 | 98% | 10.0 | 548 |
| 00:05:00 | 12 | 98% | 13.7 | 547 |
| 00:05:10 | 12 | 99% | 3.6 | 547 |
| 00:05:20 | 12 | 98% | 15.4 | 585 |
| 00:05:30 | 12 | 99% | 5.6 | 585 |
| 00:05:40 | 12 | 97% | 7.2 | 585 |
| 00:05:50 | 14 | 98% | 8.7 | 588 |
| 00:06:00 | 14 | 99% | 3.4 | 590 |
| 00:06:10 | 14 | 99% | 4.5 | 589 |
| 00:06:20 | 14 | 99% | 13.6 | 589 |
| 00:06:30 | 14 | 98% | 4.0 | 589 |
| 00:06:40 | 9 | 98% | 10.7 | 590 |
| 00:06:50 | 9 | 98% | 5.1 | 593 |
| 00:07:00 | 9 | 98% | 7.3 | 598 |
| 00:07:10 | 7 | 98% | 18.3 | 599 |
| 00:07:20 | 4 | 99% | 7.4 | 597 |
| 00:07:30 | 4 | 99% | 8.6 | 599 |
| 00:07:40 | 4 | 99% | 2.4 | 599 |
| 00:07:50 | 4 | 98% | 3.0 | 601 |
| 00:08:00 | 3 | 98% | 6.9 | 600 |
| 00:08:10 | 3 | 99% | 4.5 | 599 |
| 00:08:20 | 0 |
This section cannot be printed because one or more servers monitored in the test were monitored with a demo license.
To enable printing of this section, you must obtain a full license for server monitoring -- please contact the sales staff at Web Performance.=======
ASP.NET Errors: dnn
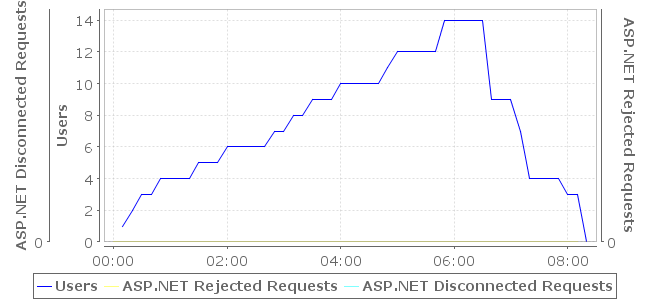
| Time | Users | ASP.NET Rejected Requests | ASP.NET Disconnected Requests |
| 00:00:10 | 1 | 0 | 0 |
| 00:00:20 | 2 | 0 | 0 |
| 00:00:30 | 3 | 0 | 0 |
| 00:00:40 | 3 | 0 | 0 |
| 00:00:50 | 4 | 0 | 0 |
| 00:01:00 | 4 | 0 | 0 |
| 00:01:10 | 4 | 0 | 0 |
| 00:01:20 | 4 | 0 | 0 |
| 00:01:30 | 5 | 0 | 0 |
| 00:01:40 | 5 | 0 | 0 |
| 00:01:50 | 5 | 0 | 0 |
| 00:02:00 | 6 | 0 | 0 |
| 00:02:10 | 6 | 0 | 0 |
| 00:02:20 | 6 | 0 | 0 |
| 00:02:30 | 6 | 0 | 0 |
| 00:02:40 | 6 | 0 | 0 |
| 00:02:50 | 7 | 0 | 0 |
| 00:03:00 | 7 | 0 | 0 |
| 00:03:10 | 8 | 0 | 0 |
| 00:03:20 | 8 | 0 | 0 |
| 00:03:30 | 9 | 0 | 0 |
| 00:03:40 | 9 | 0 | 0 |
| 00:03:50 | 9 | 0 | 0 |
| 00:04:00 | 10 | 0 | 0 |
| 00:04:10 | 10 | 0 | 0 |
| 00:04:20 | 10 | 0 | 0 |
| 00:04:30 | 10 | 0 | 0 |
| 00:04:40 | 10 | 0 | 0 |
| 00:04:50 | 11 | 0 | 0 |
| 00:05:00 | 12 | 0 | 0 |
| 00:05:10 | 12 | 0 | 0 |
| 00:05:20 | 12 | 0 | 0 |
| 00:05:30 | 12 | 0 | 0 |
| 00:05:40 | 12 | 0 | 0 |
| 00:05:50 | 14 | 0 | 0 |
| 00:06:00 | 14 | 0 | 0 |
| 00:06:10 | 14 | 0 | 0 |
| 00:06:20 | 14 | 0 | 0 |
| 00:06:30 | 14 | 0 | 0 |
| 00:06:40 | 9 | 0 | 0 |
| 00:06:50 | 9 | 0 | 0 |
| 00:07:00 | 9 | 0 | 0 |
| 00:07:10 | 7 | 0 | 0 |
| 00:07:20 | 4 | 0 | 0 |
| 00:07:30 | 4 | 0 | 0 |
| 00:07:40 | 4 | 0 | 0 |
| 00:07:50 | 4 | 0 | 0 |
| 00:08:00 | 3 | 0 | 0 |
| 00:08:10 | 3 | 0 | 0 |
| 00:08:20 | 0 |
This section cannot be printed because one or more servers monitored in the test were monitored with a demo license.
To enable printing of this section, you must obtain a full license for server monitoring -- please contact the sales staff at Web Performance.=======
ASP.NET Application Requests: dnn
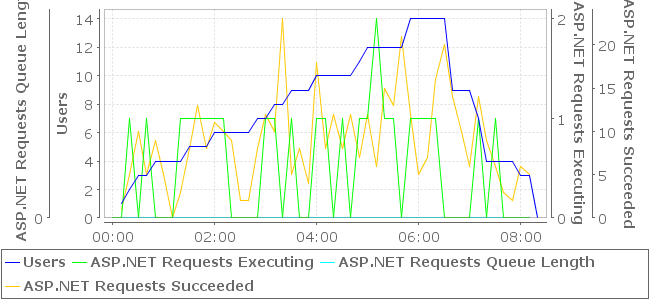
| Time | Users | ASP.NET Requests Executing | ASP.NET Requests Queue Length | ASP.NET Requests Succeeded |
| 00:00:10 | 1 | 0 | 0 | 1 |
| 00:00:20 | 2 | 1 | 0 | 5 |
| 00:00:30 | 3 | 0 | 0 | 10 |
| 00:00:40 | 3 | 1 | 0 | 5 |
| 00:00:50 | 4 | 0 | 0 | 9 |
| 00:01:00 | 4 | 0 | 0 | 5 |
| 00:01:10 | 4 | 0 | 0 | 0 |
| 00:01:20 | 4 | 1 | 0 | 3 |
| 00:01:30 | 5 | 1 | 0 | 8 |
| 00:01:40 | 5 | 1 | 0 | 13 |
| 00:01:50 | 5 | 1 | 0 | 8 |
| 00:02:00 | 6 | 1 | 0 | 11 |
| 00:02:10 | 6 | 1 | 0 | 10 |
| 00:02:20 | 6 | 0 | 0 | 9 |
| 00:02:30 | 6 | 0 | 0 | 2 |
| 00:02:40 | 6 | 0 | 0 | 2 |
| 00:02:50 | 7 | 0 | 0 | 8 |
| 00:03:00 | 7 | 1 | 0 | 12 |
| 00:03:10 | 8 | 1 | 0 | 10 |
| 00:03:20 | 8 | 0 | 0 | 23 |
| 00:03:30 | 9 | 1 | 0 | 5 |
| 00:03:40 | 9 | 0 | 0 | 8 |
| 00:03:50 | 9 | 0 | 0 | 4 |
| 00:04:00 | 10 | 1 | 0 | 18 |
| 00:04:10 | 10 | 1 | 0 | 8 |
| 00:04:20 | 10 | 0 | 0 | 12 |
| 00:04:30 | 10 | 1 | 0 | 8 |
| 00:04:40 | 10 | 0 | 0 | 12 |
| 00:04:50 | 11 | 1 | 0 | 7 |
| 00:05:00 | 12 | 1 | 0 | 12 |
| 00:05:10 | 12 | 2 | 0 | 6 |
| 00:05:20 | 12 | 1 | 0 | 15 |
| 00:05:30 | 12 | 1 | 0 | 13 |
| 00:05:40 | 12 | 0 | 0 | 21 |
| 00:05:50 | 14 | 1 | 0 | 12 |
| 00:06:00 | 14 | 1 | 0 | 5 |
| 00:06:10 | 14 | 1 | 0 | 7 |
| 00:06:20 | 14 | 1 | 0 | 16 |
| 00:06:30 | 14 | 0 | 0 | 20 |
| 00:06:40 | 9 | 0 | 0 | 14 |
| 00:06:50 | 9 | 0 | 0 | 10 |
| 00:07:00 | 9 | 0 | 0 | 6 |
| 00:07:10 | 7 | 1 | 0 | 14 |
| 00:07:20 | 4 | 0 | 0 | 9 |
| 00:07:30 | 4 | 1 | 0 | 6 |
| 00:07:40 | 4 | 0 | 0 | 3 |
| 00:07:50 | 4 | 0 | 0 | 2 |
| 00:08:00 | 3 | 0 | 0 | 6 |
| 00:08:10 | 3 | 0 | 0 | 5 |
| 00:08:20 | 0 |
This section cannot be printed because one or more servers monitored in the test were monitored with a demo license.
To enable printing of this section, you must obtain a full license for server monitoring -- please contact the sales staff at Web Performance.=======
ASP.NET Application Request Failures: dnn
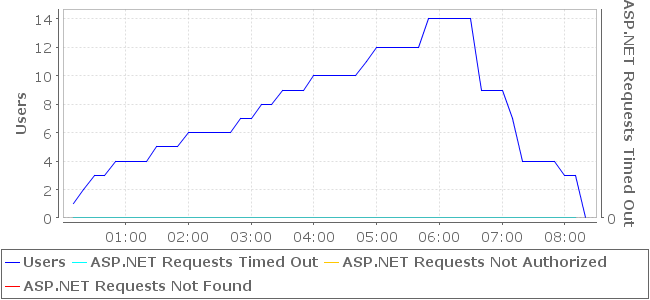
| Time | Users | ASP.NET Requests Timed Out | ASP.NET Requests Not Authorized | ASP.NET Requests Not Found |
| 00:00:10 | 1 | 0 | 0 | 0 |
| 00:00:20 | 2 | 0 | 0 | 0 |
| 00:00:30 | 3 | 0 | 0 | 0 |
| 00:00:40 | 3 | 0 | 0 | 0 |
| 00:00:50 | 4 | 0 | 0 | 0 |
| 00:01:00 | 4 | 0 | 0 | 0 |
| 00:01:10 | 4 | 0 | 0 | 0 |
| 00:01:20 | 4 | 0 | 0 | 0 |
| 00:01:30 | 5 | 0 | 0 | 0 |
| 00:01:40 | 5 | 0 | 0 | 0 |
| 00:01:50 | 5 | 0 | 0 | 0 |
| 00:02:00 | 6 | 0 | 0 | 0 |
| 00:02:10 | 6 | 0 | 0 | 0 |
| 00:02:20 | 6 | 0 | 0 | 0 |
| 00:02:30 | 6 | 0 | 0 | 0 |
| 00:02:40 | 6 | 0 | 0 | 0 |
| 00:02:50 | 7 | 0 | 0 | 0 |
| 00:03:00 | 7 | 0 | 0 | 0 |
| 00:03:10 | 8 | 0 | 0 | 0 |
| 00:03:20 | 8 | 0 | 0 | 0 |
| 00:03:30 | 9 | 0 | 0 | 0 |
| 00:03:40 | 9 | 0 | 0 | 0 |
| 00:03:50 | 9 | 0 | 0 | 0 |
| 00:04:00 | 10 | 0 | 0 | 0 |
| 00:04:10 | 10 | 0 | 0 | 0 |
| 00:04:20 | 10 | 0 | 0 | 0 |
| 00:04:30 | 10 | 0 | 0 | 0 |
| 00:04:40 | 10 | 0 | 0 | 0 |
| 00:04:50 | 11 | 0 | 0 | 0 |
| 00:05:00 | 12 | 0 | 0 | 0 |
| 00:05:10 | 12 | 0 | 0 | 0 |
| 00:05:20 | 12 | 0 | 0 | 0 |
| 00:05:30 | 12 | 0 | 0 | 0 |
| 00:05:40 | 12 | 0 | 0 | 0 |
| 00:05:50 | 14 | 0 | 0 | 0 |
| 00:06:00 | 14 | 0 | 0 | 0 |
| 00:06:10 | 14 | 0 | 0 | 0 |
| 00:06:20 | 14 | 0 | 0 | 0 |
| 00:06:30 | 14 | 0 | 0 | 0 |
| 00:06:40 | 9 | 0 | 0 | 0 |
| 00:06:50 | 9 | 0 | 0 | 0 |
| 00:07:00 | 9 | 0 | 0 | 0 |
| 00:07:10 | 7 | 0 | 0 | 0 |
| 00:07:20 | 4 | 0 | 0 | 0 |
| 00:07:30 | 4 | 0 | 0 | 0 |
| 00:07:40 | 4 | 0 | 0 | 0 |
| 00:07:50 | 4 | 0 | 0 | 0 |
| 00:08:00 | 3 | 0 | 0 | 0 |
| 00:08:10 | 3 | 0 | 0 | 0 |
| 00:08:20 | 0 |
This section cannot be printed because one or more servers monitored in the test were monitored with a demo license.
To enable printing of this section, you must obtain a full license for server monitoring -- please contact the sales staff at Web Performance.=======
ASP.NET Application Errors: dnn
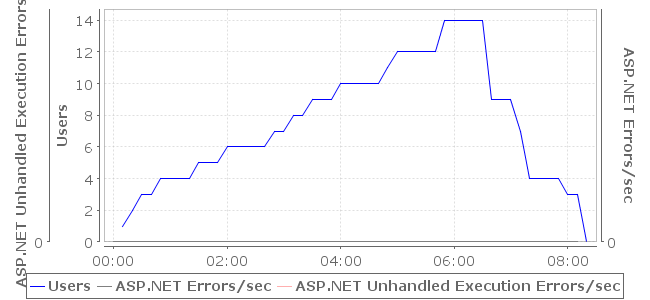
| Time | Users | ASP.NET Errors/sec | ASP.NET Unhandled Execution Errors/sec |
| 00:00:10 | 1 | 0.0 | 0.0 |
| 00:00:20 | 2 | 0.0 | 0.0 |
| 00:00:30 | 3 | 0.0 | 0.0 |
| 00:00:40 | 3 | 0.0 | 0.0 |
| 00:00:50 | 4 | 0.0 | 0.0 |
| 00:01:00 | 4 | 0.0 | 0.0 |
| 00:01:10 | 4 | 0.0 | 0.0 |
| 00:01:20 | 4 | 0.0 | 0.0 |
| 00:01:30 | 5 | 0.0 | 0.0 |
| 00:01:40 | 5 | 0.0 | 0.0 |
| 00:01:50 | 5 | 0.0 | 0.0 |
| 00:02:00 | 6 | 0.0 | 0.0 |
| 00:02:10 | 6 | 0.0 | 0.0 |
| 00:02:20 | 6 | 0.0 | 0.0 |
| 00:02:30 | 6 | 0.0 | 0.0 |
| 00:02:40 | 6 | 0.0 | 0.0 |
| 00:02:50 | 7 | 0.0 | 0.0 |
| 00:03:00 | 7 | 0.0 | 0.0 |
| 00:03:10 | 8 | 0.0 | 0.0 |
| 00:03:20 | 8 | 0.0 | 0.0 |
| 00:03:30 | 9 | 0.0 | 0.0 |
| 00:03:40 | 9 | 0.0 | 0.0 |
| 00:03:50 | 9 | 0.0 | 0.0 |
| 00:04:00 | 10 | 0.0 | 0.0 |
| 00:04:10 | 10 | 0.0 | 0.0 |
| 00:04:20 | 10 | 0.0 | 0.0 |
| 00:04:30 | 10 | 0.0 | 0.0 |
| 00:04:40 | 10 | 0.0 | 0.0 |
| 00:04:50 | 11 | 0.0 | 0.0 |
| 00:05:00 | 12 | 0.0 | 0.0 |
| 00:05:10 | 12 | 0.0 | 0.0 |
| 00:05:20 | 12 | 0.0 | 0.0 |
| 00:05:30 | 12 | 0.0 | 0.0 |
| 00:05:40 | 12 | 0.0 | 0.0 |
| 00:05:50 | 14 | 0.0 | 0.0 |
| 00:06:00 | 14 | 0.0 | 0.0 |
| 00:06:10 | 14 | 0.0 | 0.0 |
| 00:06:20 | 14 | 0.0 | 0.0 |
| 00:06:30 | 14 | 0.0 | 0.0 |
| 00:06:40 | 9 | 0.0 | 0.0 |
| 00:06:50 | 9 | 0.0 | 0.0 |
| 00:07:00 | 9 | 0.0 | 0.0 |
| 00:07:10 | 7 | 0.0 | 0.0 |
| 00:07:20 | 4 | 0.0 | 0.0 |
| 00:07:30 | 4 | 0.0 | 0.0 |
| 00:07:40 | 4 | 0.0 | 0.0 |
| 00:07:50 | 4 | 0.0 | 0.0 |
| 00:08:00 | 3 | 0.0 | 0.0 |
| 00:08:10 | 3 | 0.0 | 0.0 |
| 00:08:20 | 0 |
This section cannot be printed because one or more servers monitored in the test were monitored with a demo license.
To enable printing of this section, you must obtain a full license for server monitoring -- please contact the sales staff at Web Performance.=======
ASP.NET Sessions: dnn
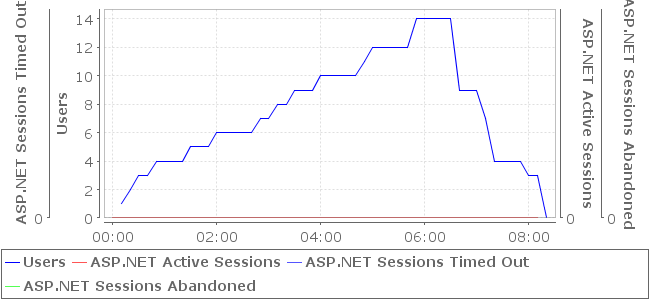
| Time | Users | ASP.NET Active Sessions | ASP.NET Sessions Timed Out | ASP.NET Sessions Abandoned |
| 00:00:10 | 1 | 0 | 0 | 0 |
| 00:00:20 | 2 | 0 | 0 | 0 |
| 00:00:30 | 3 | 0 | 0 | 0 |
| 00:00:40 | 3 | 0 | 0 | 0 |
| 00:00:50 | 4 | 0 | 0 | 0 |
| 00:01:00 | 4 | 0 | 0 | 0 |
| 00:01:10 | 4 | 0 | 0 | 0 |
| 00:01:20 | 4 | 0 | 0 | 0 |
| 00:01:30 | 5 | 0 | 0 | 0 |
| 00:01:40 | 5 | 0 | 0 | 0 |
| 00:01:50 | 5 | 0 | 0 | 0 |
| 00:02:00 | 6 | 0 | 0 | 0 |
| 00:02:10 | 6 | 0 | 0 | 0 |
| 00:02:20 | 6 | 0 | 0 | 0 |
| 00:02:30 | 6 | 0 | 0 | 0 |
| 00:02:40 | 6 | 0 | 0 | 0 |
| 00:02:50 | 7 | 0 | 0 | 0 |
| 00:03:00 | 7 | 0 | 0 | 0 |
| 00:03:10 | 8 | 0 | 0 | 0 |
| 00:03:20 | 8 | 0 | 0 | 0 |
| 00:03:30 | 9 | 0 | 0 | 0 |
| 00:03:40 | 9 | 0 | 0 | 0 |
| 00:03:50 | 9 | 0 | 0 | 0 |
| 00:04:00 | 10 | 0 | 0 | 0 |
| 00:04:10 | 10 | 0 | 0 | 0 |
| 00:04:20 | 10 | 0 | 0 | 0 |
| 00:04:30 | 10 | 0 | 0 | 0 |
| 00:04:40 | 10 | 0 | 0 | 0 |
| 00:04:50 | 11 | 0 | 0 | 0 |
| 00:05:00 | 12 | 0 | 0 | 0 |
| 00:05:10 | 12 | 0 | 0 | 0 |
| 00:05:20 | 12 | 0 | 0 | 0 |
| 00:05:30 | 12 | 0 | 0 | 0 |
| 00:05:40 | 12 | 0 | 0 | 0 |
| 00:05:50 | 14 | 0 | 0 | 0 |
| 00:06:00 | 14 | 0 | 0 | 0 |
| 00:06:10 | 14 | 0 | 0 | 0 |
| 00:06:20 | 14 | 0 | 0 | 0 |
| 00:06:30 | 14 | 0 | 0 | 0 |
| 00:06:40 | 9 | 0 | 0 | 0 |
| 00:06:50 | 9 | 0 | 0 | 0 |
| 00:07:00 | 9 | 0 | 0 | 0 |
| 00:07:10 | 7 | 0 | 0 | 0 |
| 00:07:20 | 4 | 0 | 0 | 0 |
| 00:07:30 | 4 | 0 | 0 | 0 |
| 00:07:40 | 4 | 0 | 0 | 0 |
| 00:07:50 | 4 | 0 | 0 | 0 |
| 00:08:00 | 3 | 0 | 0 | 0 |
| 00:08:10 | 3 | 0 | 0 | 0 |
| 00:08:20 | 0 |
This section cannot be printed because one or more servers monitored in the test were monitored with a demo license.
To enable printing of this section, you must obtain a full license for server monitoring -- please contact the sales staff at Web Performance.=======
ASP.NET Applications: dnn
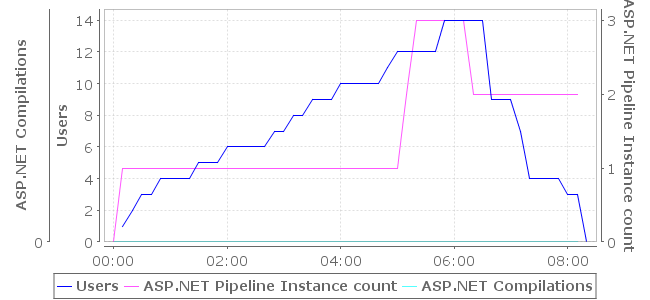
| Time | Users | ASP.NET Pipeline Instance count | ASP.NET Compilations |
| 00:00:10 | 1 | 1 | 0 |
| 00:00:20 | 2 | 1 | 0 |
| 00:00:30 | 3 | 1 | 0 |
| 00:00:40 | 3 | 1 | 0 |
| 00:00:50 | 4 | 1 | 0 |
| 00:01:00 | 4 | 1 | 0 |
| 00:01:10 | 4 | 1 | 0 |
| 00:01:20 | 4 | 1 | 0 |
| 00:01:30 | 5 | 1 | 0 |
| 00:01:40 | 5 | 1 | 0 |
| 00:01:50 | 5 | 1 | 0 |
| 00:02:00 | 6 | 1 | 0 |
| 00:02:10 | 6 | 1 | 0 |
| 00:02:20 | 6 | 1 | 0 |
| 00:02:30 | 6 | 1 | 0 |
| 00:02:40 | 6 | 1 | 0 |
| 00:02:50 | 7 | 1 | 0 |
| 00:03:00 | 7 | 1 | 0 |
| 00:03:10 | 8 | 1 | 0 |
| 00:03:20 | 8 | 1 | 0 |
| 00:03:30 | 9 | 1 | 0 |
| 00:03:40 | 9 | 1 | 0 |
| 00:03:50 | 9 | 1 | 0 |
| 00:04:00 | 10 | 1 | 0 |
| 00:04:10 | 10 | 1 | 0 |
| 00:04:20 | 10 | 1 | 0 |
| 00:04:30 | 10 | 1 | 0 |
| 00:04:40 | 10 | 1 | 0 |
| 00:04:50 | 11 | 1 | 0 |
| 00:05:00 | 12 | 1 | 0 |
| 00:05:10 | 12 | 2 | 0 |
| 00:05:20 | 12 | 3 | 0 |
| 00:05:30 | 12 | 3 | 0 |
| 00:05:40 | 12 | 3 | 0 |
| 00:05:50 | 14 | 3 | 0 |
| 00:06:00 | 14 | 3 | 0 |
| 00:06:10 | 14 | 3 | 0 |
| 00:06:20 | 14 | 2 | 0 |
| 00:06:30 | 14 | 2 | 0 |
| 00:06:40 | 9 | 2 | 0 |
| 00:06:50 | 9 | 2 | 0 |
| 00:07:00 | 9 | 2 | 0 |
| 00:07:10 | 7 | 2 | 0 |
| 00:07:20 | 4 | 2 | 0 |
| 00:07:30 | 4 | 2 | 0 |
| 00:07:40 | 4 | 2 | 0 |
| 00:07:50 | 4 | 2 | 0 |
| 00:08:00 | 3 | 2 | 0 |
| 00:08:10 | 3 | 2 | 0 |
| 00:08:20 | 0 |
This section cannot be printed because one or more servers monitored in the test were monitored with a demo license.
To enable printing of this section, you must obtain a full license for server monitoring -- please contact the sales staff at Web Performance.=======
IIS Summary: dnn
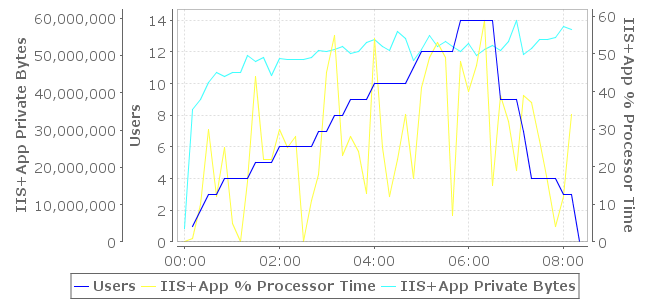
| Time | Users | IIS+App % Processor Time | IIS+App Private Bytes |
| 00:00:10 | 1 | 1% | 33.8 MB |
| 00:00:20 | 2 | 10% | 36.3 MB |
| 00:00:30 | 3 | 30% | 40.8 MB |
| 00:00:40 | 3 | 12% | 43.2 MB |
| 00:00:50 | 4 | 25% | 42.4 MB |
| 00:01:00 | 4 | 5% | 43.2 MB |
| 00:01:10 | 4 | 0% | 43.2 MB |
| 00:01:20 | 4 | 16% | 47.7 MB |
| 00:01:30 | 5 | 44% | 46.2 MB |
| 00:01:40 | 5 | 22% | 47.1 MB |
| 00:01:50 | 5 | 22% | 42.5 MB |
| 00:02:00 | 6 | 30% | 46.9 MB |
| 00:02:10 | 6 | 25% | 46.7 MB |
| 00:02:20 | 6 | 28% | 46.6 MB |
| 00:02:30 | 6 | 0% | 46.6 MB |
| 00:02:40 | 6 | 11% | 47.0 MB |
| 00:02:50 | 7 | 18% | 48.8 MB |
| 00:03:00 | 7 | 45% | 48.7 MB |
| 00:03:10 | 8 | 55% | 49.2 MB |
| 00:03:20 | 8 | 23% | 49.9 MB |
| 00:03:30 | 9 | 28% | 48.1 MB |
| 00:03:40 | 9 | 24% | 48.5 MB |
| 00:03:50 | 9 | 13% | 50.9 MB |
| 00:04:00 | 10 | 54% | 51.6 MB |
| 00:04:10 | 10 | 25% | 49.9 MB |
| 00:04:20 | 10 | 12% | 48.9 MB |
| 00:04:30 | 10 | 22% | 53.8 MB |
| 00:04:40 | 10 | 34% | 51.9 MB |
| 00:04:50 | 11 | 17% | 46.3 MB |
| 00:05:00 | 12 | 41% | 49.1 MB |
| 00:05:10 | 12 | 49% | 52.7 MB |
| 00:05:20 | 12 | 53% | 50.0 MB |
| 00:05:30 | 12 | 49% | 51.2 MB |
| 00:05:40 | 12 | 7% | 50.0 MB |
| 00:05:50 | 14 | 48% | 48.8 MB |
| 00:06:00 | 14 | 40% | 50.7 MB |
| 00:06:10 | 14 | 47% | 47.6 MB |
| 00:06:20 | 14 | 59% | 49.3 MB |
| 00:06:30 | 14 | 15% | 50.2 MB |
| 00:06:40 | 9 | 39% | 48.9 MB |
| 00:06:50 | 9 | 32% | 51.2 MB |
| 00:07:00 | 9 | 19% | 56.7 MB |
| 00:07:10 | 7 | 39% | 47.9 MB |
| 00:07:20 | 4 | 37% | 49.4 MB |
| 00:07:30 | 4 | 27% | 51.8 MB |
| 00:07:40 | 4 | 16% | 51.8 MB |
| 00:07:50 | 4 | 4% | 52.3 MB |
| 00:08:00 | 3 | 12% | 55.1 MB |
| 00:08:10 | 3 | 34% | 54.4 MB |
| 00:08:20 | 0 |
This section cannot be printed because one or more servers monitored in the test were monitored with a demo license.
To enable printing of this section, you must obtain a full license for server monitoring -- please contact the sales staff at Web Performance.=======
IIS+App Processor: dnn
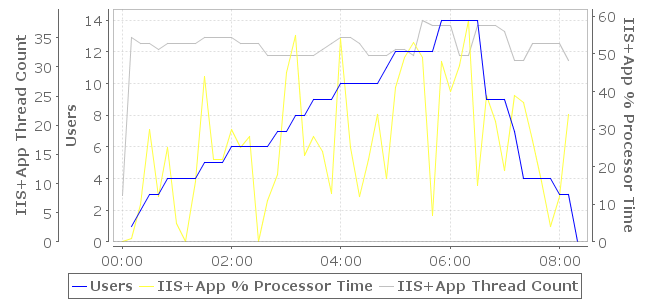
| Time | Users | IIS+App % Processor Time | IIS+App Thread Count |
| 00:00:10 | 1 | 1% | 35 |
| 00:00:20 | 2 | 10% | 34 |
| 00:00:30 | 3 | 30% | 34 |
| 00:00:40 | 3 | 12% | 33 |
| 00:00:50 | 4 | 25% | 34 |
| 00:01:00 | 4 | 5% | 34 |
| 00:01:10 | 4 | 0% | 34 |
| 00:01:20 | 4 | 16% | 34 |
| 00:01:30 | 5 | 44% | 35 |
| 00:01:40 | 5 | 22% | 35 |
| 00:01:50 | 5 | 22% | 35 |
| 00:02:00 | 6 | 30% | 35 |
| 00:02:10 | 6 | 25% | 34 |
| 00:02:20 | 6 | 28% | 34 |
| 00:02:30 | 6 | 0% | 34 |
| 00:02:40 | 6 | 11% | 32 |
| 00:02:50 | 7 | 18% | 32 |
| 00:03:00 | 7 | 45% | 32 |
| 00:03:10 | 8 | 55% | 32 |
| 00:03:20 | 8 | 23% | 32 |
| 00:03:30 | 9 | 28% | 32 |
| 00:03:40 | 9 | 24% | 33 |
| 00:03:50 | 9 | 13% | 34 |
| 00:04:00 | 10 | 54% | 35 |
| 00:04:10 | 10 | 25% | 35 |
| 00:04:20 | 10 | 12% | 34 |
| 00:04:30 | 10 | 22% | 32 |
| 00:04:40 | 10 | 34% | 32 |
| 00:04:50 | 11 | 17% | 32 |
| 00:05:00 | 12 | 41% | 33 |
| 00:05:10 | 12 | 49% | 33 |
| 00:05:20 | 12 | 53% | 32 |
| 00:05:30 | 12 | 49% | 38 |
| 00:05:40 | 12 | 7% | 37 |
| 00:05:50 | 14 | 48% | 37 |
| 00:06:00 | 14 | 40% | 37 |
| 00:06:10 | 14 | 47% | 32 |
| 00:06:20 | 14 | 59% | 32 |
| 00:06:30 | 14 | 15% | 37 |
| 00:06:40 | 9 | 39% | 37 |
| 00:06:50 | 9 | 32% | 37 |
| 00:07:00 | 9 | 19% | 36 |
| 00:07:10 | 7 | 39% | 31 |
| 00:07:20 | 4 | 37% | 31 |
| 00:07:30 | 4 | 27% | 34 |
| 00:07:40 | 4 | 16% | 34 |
| 00:07:50 | 4 | 4% | 34 |
| 00:08:00 | 3 | 12% | 34 |
| 00:08:10 | 3 | 34% | 31 |
| 00:08:20 | 0 |
This section cannot be printed because one or more servers monitored in the test were monitored with a demo license.
To enable printing of this section, you must obtain a full license for server monitoring -- please contact the sales staff at Web Performance.=======
IIS Connections: dnn
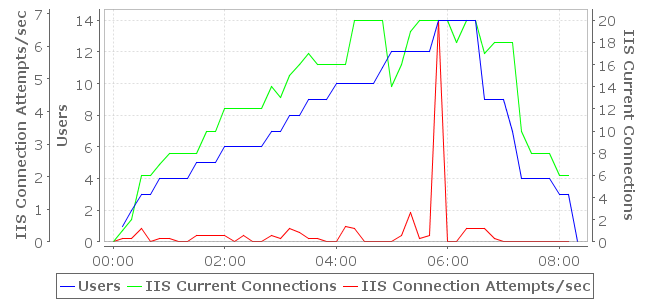
| Time | Users | IIS Current Connections | IIS Connection Attempts/sec |
| 00:00:10 | 1 | 1 | 0.1 |
| 00:00:20 | 2 | 2 | 0.1 |
| 00:00:30 | 3 | 6 | 0.4 |
| 00:00:40 | 3 | 6 | 0.0 |
| 00:00:50 | 4 | 7 | 0.1 |
| 00:01:00 | 4 | 8 | 0.1 |
| 00:01:10 | 4 | 8 | 0.0 |
| 00:01:20 | 4 | 8 | 0.0 |
| 00:01:30 | 5 | 8 | 0.2 |
| 00:01:40 | 5 | 10 | 0.2 |
| 00:01:50 | 5 | 10 | 0.2 |
| 00:02:00 | 6 | 12 | 0.2 |
| 00:02:10 | 6 | 12 | 0.0 |
| 00:02:20 | 6 | 12 | 0.2 |
| 00:02:30 | 6 | 12 | 0.0 |
| 00:02:40 | 6 | 12 | 0.0 |
| 00:02:50 | 7 | 14 | 0.2 |
| 00:03:00 | 7 | 13 | 0.1 |
| 00:03:10 | 8 | 15 | 0.4 |
| 00:03:20 | 8 | 16 | 0.3 |
| 00:03:30 | 9 | 17 | 0.1 |
| 00:03:40 | 9 | 16 | 0.1 |
| 00:03:50 | 9 | 16 | 0.0 |
| 00:04:00 | 10 | 16 | 0.0 |
| 00:04:10 | 10 | 16 | 0.5 |
| 00:04:20 | 10 | 20 | 0.4 |
| 00:04:30 | 10 | 20 | 0.0 |
| 00:04:40 | 10 | 20 | 0.0 |
| 00:04:50 | 11 | 20 | 0.0 |
| 00:05:00 | 12 | 14 | 0.0 |
| 00:05:10 | 12 | 16 | 0.2 |
| 00:05:20 | 12 | 19 | 0.9 |
| 00:05:30 | 12 | 20 | 0.1 |
| 00:05:40 | 12 | 20 | 0.2 |
| 00:05:50 | 14 | 20 | 6.8 |
| 00:06:00 | 14 | 20 | 0.0 |
| 00:06:10 | 14 | 18 | 0.0 |
| 00:06:20 | 14 | 20 | 0.4 |
| 00:06:30 | 14 | 20 | 0.4 |
| 00:06:40 | 9 | 17 | 0.4 |
| 00:06:50 | 9 | 18 | 0.1 |
| 00:07:00 | 9 | 18 | 0.0 |
| 00:07:10 | 7 | 18 | 0.0 |
| 00:07:20 | 4 | 10 | 0.0 |
| 00:07:30 | 4 | 8 | 0.0 |
| 00:07:40 | 4 | 8 | 0.0 |
| 00:07:50 | 4 | 8 | 0.0 |
| 00:08:00 | 3 | 6 | 0.0 |
| 00:08:10 | 3 | 6 | 0.0 |
| 00:08:20 | 0 |
This section cannot be printed because one or more servers monitored in the test were monitored with a demo license.
To enable printing of this section, you must obtain a full license for server monitoring -- please contact the sales staff at Web Performance.=======
IIS Requests: dnn
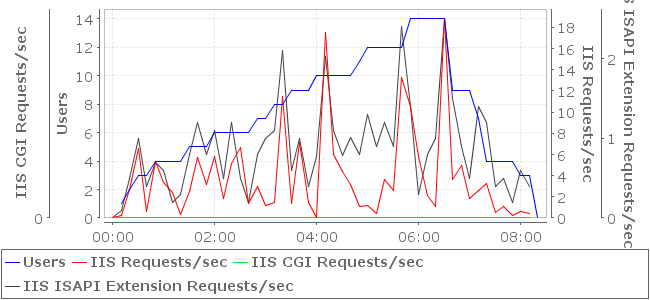
| Time | Users | IIS Requests/sec | IIS CGI Requests/sec | IIS ISAPI Extension Requests/sec |
| 00:00:10 | 1 | 0.2 | 0.0 | 0.1 |
| 00:00:20 | 2 | 2.7 | 0.0 | 0.5 |
| 00:00:30 | 3 | 6.6 | 0.0 | 1.0 |
| 00:00:40 | 3 | 0.6 | 0.0 | 0.4 |
| 00:00:50 | 4 | 5.3 | 0.0 | 0.7 |
| 00:01:00 | 4 | 3.3 | 0.0 | 0.6 |
| 00:01:10 | 4 | 2.4 | 0.0 | 0.2 |
| 00:01:20 | 4 | 0.3 | 0.0 | 0.3 |
| 00:01:30 | 5 | 2.5 | 0.0 | 0.8 |
| 00:01:40 | 5 | 5.7 | 0.0 | 1.2 |
| 00:01:50 | 5 | 3.2 | 0.0 | 0.8 |
| 00:02:00 | 6 | 5.8 | 0.0 | 1.1 |
| 00:02:10 | 6 | 1.8 | 0.0 | 0.5 |
| 00:02:20 | 6 | 5.1 | 0.0 | 1.2 |
| 00:02:30 | 6 | 6.7 | 0.0 | 0.5 |
| 00:02:40 | 6 | 1.4 | 0.0 | 0.2 |
| 00:02:50 | 7 | 3.0 | 0.0 | 0.8 |
| 00:03:00 | 7 | 1.2 | 0.0 | 1.0 |
| 00:03:10 | 8 | 1.5 | 0.0 | 1.1 |
| 00:03:20 | 8 | 11.5 | 0.0 | 2.1 |
| 00:03:30 | 9 | 1.4 | 0.0 | 0.6 |
| 00:03:40 | 9 | 7.1 | 0.0 | 1.0 |
| 00:03:50 | 9 | 1.5 | 0.0 | 0.4 |
| 00:04:00 | 10 | 0.0 | 0.0 | 0.8 |
| 00:04:10 | 10 | 17.5 | 0.0 | 2.0 |
| 00:04:20 | 10 | 6.0 | 0.0 | 1.1 |
| 00:04:30 | 10 | 4.3 | 0.0 | 0.8 |
| 00:04:40 | 10 | 3.1 | 0.0 | 1.0 |
| 00:04:50 | 11 | 1.1 | 0.0 | 0.8 |
| 00:05:00 | 12 | 1.2 | 0.0 | 1.3 |
| 00:05:10 | 12 | 0.4 | 0.0 | 0.9 |
| 00:05:20 | 12 | 3.6 | 0.0 | 1.2 |
| 00:05:30 | 12 | 2.6 | 0.0 | 0.9 |
| 00:05:40 | 12 | 13.3 | 0.0 | 2.4 |
| 00:05:50 | 14 | 10.5 | 0.0 | 1.4 |
| 00:06:00 | 14 | 5.8 | 0.0 | 0.3 |
| 00:06:10 | 14 | 2.1 | 0.0 | 0.8 |
| 00:06:20 | 14 | 1.1 | 0.0 | 1.0 |
| 00:06:30 | 14 | 18.8 | 0.0 | 2.5 |
| 00:06:40 | 9 | 3.6 | 0.0 | 1.5 |
| 00:06:50 | 9 | 5.0 | 0.0 | 0.9 |
| 00:07:00 | 9 | 1.8 | 0.0 | 0.5 |
| 00:07:10 | 7 | 2.6 | 0.0 | 1.4 |
| 00:07:20 | 4 | 3.3 | 0.0 | 1.2 |
| 00:07:30 | 4 | 0.5 | 0.0 | 0.4 |
| 00:07:40 | 4 | 1.1 | 0.0 | 0.5 |
| 00:07:50 | 4 | 0.2 | 0.0 | 0.2 |
| 00:08:00 | 3 | 0.6 | 0.0 | 0.6 |
| 00:08:10 | 3 | 0.4 | 0.0 | 0.4 |
| 00:08:20 | 0 |
This section cannot be printed because one or more servers monitored in the test were monitored with a demo license.
To enable printing of this section, you must obtain a full license for server monitoring -- please contact the sales staff at Web Performance.=======
IIS+App Memory: dnn
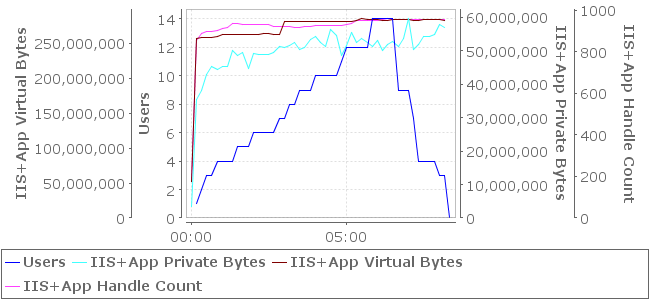
| Time | Users | IIS+App Private Bytes | IIS+App Virtual Bytes | IIS+App Handle Count |
| 00:00:10 | 1 | 33.8 MB | 244.5 MB | 852 |
| 00:00:20 | 2 | 36.3 MB | 246.6 MB | 889 |
| 00:00:30 | 3 | 40.8 MB | 246.8 MB | 900 |
| 00:00:40 | 3 | 43.2 MB | 246.5 MB | 898 |
| 00:00:50 | 4 | 42.4 MB | 246.9 MB | 901 |
| 00:01:00 | 4 | 43.2 MB | 249.9 MB | 912 |
| 00:01:10 | 4 | 43.2 MB | 249.9 MB | 916 |
| 00:01:20 | 4 | 47.7 MB | 250.2 MB | 934 |
| 00:01:30 | 5 | 46.2 MB | 250.5 MB | 936 |
| 00:01:40 | 5 | 47.1 MB | 250.5 MB | 930 |
| 00:01:50 | 5 | 42.5 MB | 250.5 MB | 930 |
| 00:02:00 | 6 | 46.9 MB | 250.5 MB | 930 |
| 00:02:10 | 6 | 46.7 MB | 250.2 MB | 932 |
| 00:02:20 | 6 | 46.6 MB | 251.2 MB | 930 |
| 00:02:30 | 6 | 46.6 MB | 251.2 MB | 930 |
| 00:02:40 | 6 | 47.0 MB | 250.7 MB | 924 |
| 00:02:50 | 7 | 48.8 MB | 250.7 MB | 924 |
| 00:03:00 | 7 | 48.7 MB | 267.5 MB | 924 |
| 00:03:10 | 8 | 49.2 MB | 267.5 MB | 920 |
| 00:03:20 | 8 | 49.9 MB | 267.5 MB | 918 |
| 00:03:30 | 9 | 48.1 MB | 267.5 MB | 918 |
| 00:03:40 | 9 | 48.5 MB | 267.7 MB | 923 |
| 00:03:50 | 9 | 50.9 MB | 268.0 MB | 922 |
| 00:04:00 | 10 | 51.6 MB | 268.3 MB | 927 |
| 00:04:10 | 10 | 49.9 MB | 268.3 MB | 927 |
| 00:04:20 | 10 | 48.9 MB | 268.1 MB | 926 |
| 00:04:30 | 10 | 53.8 MB | 267.6 MB | 926 |
| 00:04:40 | 10 | 51.9 MB | 267.6 MB | 926 |
| 00:04:50 | 11 | 46.3 MB | 267.6 MB | 926 |
| 00:05:00 | 12 | 49.1 MB | 267.8 MB | 931 |
| 00:05:10 | 12 | 52.7 MB | 267.8 MB | 937 |
| 00:05:20 | 12 | 50.0 MB | 270.0 MB | 952 |
| 00:05:30 | 12 | 51.2 MB | 271.5 MB | 951 |
| 00:05:40 | 12 | 50.0 MB | 271.2 MB | 950 |
| 00:05:50 | 14 | 48.8 MB | 271.2 MB | 949 |
| 00:06:00 | 14 | 50.7 MB | 271.2 MB | 949 |
| 00:06:10 | 14 | 47.6 MB | 270.0 MB | 957 |
| 00:06:20 | 14 | 49.3 MB | 270.0 MB | 958 |
| 00:06:30 | 14 | 50.2 MB | 271.2 MB | 957 |
| 00:06:40 | 9 | 48.9 MB | 271.2 MB | 957 |
| 00:06:50 | 9 | 51.2 MB | 271.2 MB | 957 |
| 00:07:00 | 9 | 56.7 MB | 271.0 MB | 957 |
| 00:07:10 | 7 | 47.9 MB | 269.7 MB | 957 |
| 00:07:20 | 4 | 49.4 MB | 269.7 MB | 957 |
| 00:07:30 | 4 | 51.8 MB | 270.5 MB | 957 |
| 00:07:40 | 4 | 51.8 MB | 270.5 MB | 957 |
| 00:07:50 | 4 | 52.3 MB | 270.5 MB | 957 |
| 00:08:00 | 3 | 55.1 MB | 270.5 MB | 957 |
| 00:08:10 | 3 | 54.4 MB | 269.7 MB | 957 |
| 00:08:20 | 0 |
This section cannot be printed because one or more servers monitored in the test were monitored with a demo license.
To enable printing of this section, you must obtain a full license for server monitoring -- please contact the sales staff at Web Performance.=======
IIS File Cache: dnn
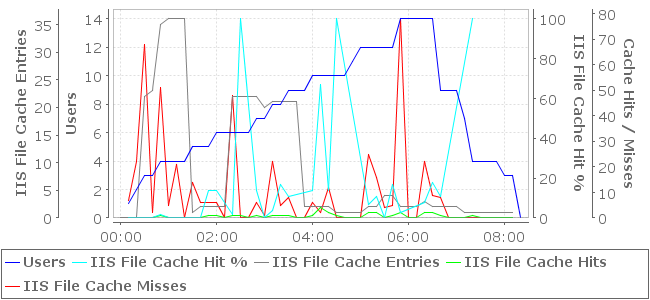
| Time | Users | IIS File Cache Hit % | IIS File Cache Entries | IIS File Cache Hits | IIS File Cache Misses |
| 00:00:10 | 1 | 0% | 0 | 0 | 7 |
| 00:00:20 | 2 | 0% | 0 | 0 | 22 |
| 00:00:30 | 3 | 0% | 22 | 0 | 68 |
| 00:00:40 | 3 | 0% | 23 | 0 | 2 |
| 00:00:50 | 4 | 2% | 35 | 1 | 51 |
| 00:01:00 | 4 | 0% | 36 | 0 | 5 |
| 00:01:10 | 4 | 0% | 36 | 0 | 21 |
| 00:01:20 | 4 | 36 | 0 | 0 | |
| 00:01:30 | 5 | 0% | 1 | 0 | 14 |
| 00:01:40 | 5 | 0% | 2 | 0 | 6 |
| 00:01:50 | 5 | 14% | 2 | 1 | 6 |
| 00:02:00 | 6 | 14% | 2 | 1 | 6 |
| 00:02:10 | 6 | 2 | 0 | 0 | |
| 00:02:20 | 6 | 2% | 22 | 1 | 48 |
| 00:02:30 | 6 | 100% | 22 | 1 | 0 |
| 00:02:40 | 6 | 22 | 0 | 0 | |
| 00:02:50 | 7 | 14% | 22 | 1 | 6 |
| 00:03:00 | 7 | 0% | 20 | 0 | 1 |
| 00:03:10 | 8 | 4% | 21 | 1 | 22 |
| 00:03:20 | 8 | 17% | 21 | 1 | 5 |
| 00:03:30 | 9 | 11% | 21 | 1 | 8 |
| 00:03:40 | 9 | 21 | 0 | 0 | |
| 00:03:50 | 9 | 2 | 0 | 0 | |
| 00:04:00 | 10 | 14% | 2 | 1 | 6 |
| 00:04:10 | 10 | 67% | 2 | 4 | 2 |
| 00:04:20 | 10 | 14% | 2 | 2 | 12 |
| 00:04:30 | 10 | 100% | 1 | 1 | 0 |
| 00:04:40 | 10 | 1 | 0 | 0 | |
| 00:04:50 | 11 | 1 | 0 | 0 | |
| 00:05:00 | 12 | 1 | 0 | 0 | |
| 00:05:10 | 12 | 7% | 2 | 2 | 25 |
| 00:05:20 | 12 | 11% | 2 | 2 | 16 |
| 00:05:30 | 12 | 0% | 4 | 0 | 4 |
| 00:05:40 | 12 | 17% | 4 | 1 | 5 |
| 00:05:50 | 14 | 3% | 2 | 2 | 78 |
| 00:06:00 | 14 | 2 | 0 | 0 | |
| 00:06:10 | 14 | 2 | 0 | 0 | |
| 00:06:20 | 14 | 8% | 3 | 2 | 22 |
| 00:06:30 | 14 | 18% | 2 | 2 | 9 |
| 00:06:40 | 9 | 11% | 2 | 1 | 8 |
| 00:06:50 | 9 | 2 | 0 | 0 | |
| 00:07:00 | 9 | 2 | 0 | 0 | |
| 00:07:10 | 7 | 1 | 0 | 0 | |
| 00:07:20 | 4 | 100% | 1 | 1 | 0 |
| 00:07:30 | 4 | 1 | 0 | 0 | |
| 00:07:40 | 4 | 1 | 0 | 0 | |
| 00:07:50 | 4 | 1 | 0 | 0 | |
| 00:08:00 | 3 | 1 | 0 | 0 | |
| 00:08:10 | 3 | 1 | 0 | 0 | |
| 00:08:20 | 0 |
This section cannot be printed because one or more servers monitored in the test were monitored with a demo license.
To enable printing of this section, you must obtain a full license for server monitoring -- please contact the sales staff at Web Performance.=======
IIS URI Cache: dnn
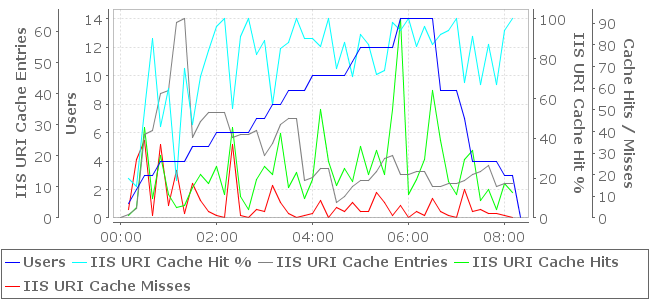
| Time | Users | IIS URI Cache Hit % | IIS URI Cache Entries | IIS URI Cache Hits | IIS URI Cache Misses |
| 00:00:10 | 1 | 20% | 1 | 1 | 4 |
| 00:00:20 | 2 | 16% | 3 | 5 | 27 |
| 00:00:30 | 3 | 54% | 27 | 42 | 36 |
| 00:00:40 | 3 | 90% | 28 | 9 | 1 |
| 00:00:50 | 4 | 46% | 40 | 29 | 34 |
| 00:01:00 | 4 | 65% | 41 | 11 | 6 |
| 00:01:10 | 4 | 19% | 63 | 5 | 22 |
| 00:01:20 | 4 | 75% | 64 | 6 | 2 |
| 00:01:30 | 5 | 47% | 26 | 14 | 16 |
| 00:01:40 | 5 | 71% | 31 | 20 | 8 |
| 00:01:50 | 5 | 84% | 34 | 16 | 3 |
| 00:02:00 | 6 | 96% | 34 | 24 | 1 |
| 00:02:10 | 6 | 100% | 34 | 11 | 0 |
| 00:02:20 | 6 | 55% | 26 | 42 | 34 |
| 00:02:30 | 6 | 91% | 27 | 10 | 1 |
| 00:02:40 | 6 | 100% | 27 | 4 | 0 |
| 00:02:50 | 7 | 82% | 28 | 18 | 4 |
| 00:03:00 | 7 | 89% | 20 | 24 | 3 |
| 00:03:10 | 8 | 57% | 24 | 20 | 15 |
| 00:03:20 | 8 | 85% | 30 | 39 | 7 |
| 00:03:30 | 9 | 88% | 32 | 14 | 2 |
| 00:03:40 | 9 | 100% | 32 | 21 | 0 |
| 00:03:50 | 9 | 90% | 12 | 9 | 1 |
| 00:04:00 | 10 | 90% | 13 | 18 | 2 |
| 00:04:10 | 10 | 86% | 16 | 50 | 8 |
| 00:04:20 | 10 | 100% | 16 | 26 | 0 |
| 00:04:30 | 10 | 75% | 5 | 15 | 5 |
| 00:04:40 | 10 | 88% | 7 | 23 | 3 |
| 00:04:50 | 11 | 71% | 10 | 17 | 7 |
| 00:05:00 | 12 | 92% | 12 | 33 | 3 |
| 00:05:10 | 12 | 87% | 12 | 20 | 3 |
| 00:05:20 | 12 | 72% | 15 | 31 | 12 |
| 00:05:30 | 12 | 74% | 19 | 20 | 7 |
| 00:05:40 | 12 | 98% | 20 | 50 | 1 |
| 00:05:50 | 14 | 94% | 14 | 92 | 6 |
| 00:06:00 | 14 | 100% | 14 | 11 | 0 |
| 00:06:10 | 14 | 86% | 15 | 18 | 3 |
| 00:06:20 | 14 | 96% | 15 | 27 | 1 |
| 00:06:30 | 14 | 87% | 10 | 59 | 9 |
| 00:06:40 | 9 | 92% | 10 | 36 | 3 |
| 00:06:50 | 9 | 94% | 11 | 17 | 1 |
| 00:07:00 | 9 | 100% | 11 | 11 | 0 |
| 00:07:10 | 7 | 68% | 12 | 27 | 13 |
| 00:07:20 | 4 | 91% | 14 | 31 | 3 |
| 00:07:30 | 4 | 67% | 15 | 8 | 4 |
| 00:07:40 | 4 | 87% | 17 | 13 | 2 |
| 00:07:50 | 4 | 67% | 10 | 4 | 2 |
| 00:08:00 | 3 | 94% | 11 | 16 | 1 |
| 00:08:10 | 3 | 100% | 11 | 12 | 0 |
| 00:08:20 | 0 |
This section cannot be printed because one or more servers monitored in the test were monitored with a demo license.
To enable printing of this section, you must obtain a full license for server monitoring -- please contact the sales staff at Web Performance.=======
IIS Kernel URI Cache: dnn
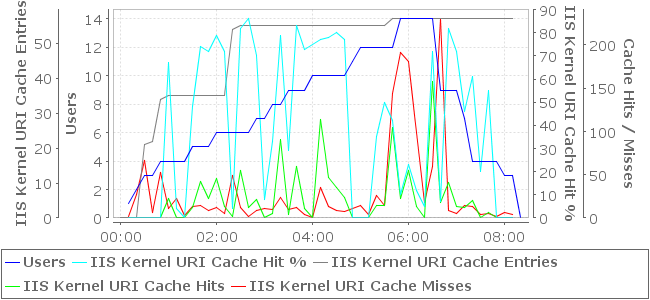
| Time | Users | IIS Kernel URI Cache Hit % | IIS Kernel URI Cache Entries | IIS Kernel URI Cache Hits | IIS Kernel URI Cache Misses |
| 00:00:10 | 1 | 0% | 0 | 0 | 2 |
| 00:00:20 | 2 | 0% | 0 | 0 | 27 |
| 00:00:30 | 3 | 0% | 21 | 0 | 66 |
| 00:00:40 | 3 | 0% | 22 | 0 | 6 |
| 00:00:50 | 4 | 0% | 34 | 0 | 53 |
| 00:01:00 | 4 | 67% | 35 | 22 | 11 |
| 00:01:10 | 4 | 4% | 35 | 1 | 23 |
| 00:01:20 | 4 | 0% | 35 | 0 | 3 |
| 00:01:30 | 5 | 48% | 35 | 12 | 13 |
| 00:01:40 | 5 | 74% | 35 | 42 | 15 |
| 00:01:50 | 5 | 72% | 35 | 23 | 9 |
| 00:02:00 | 6 | 79% | 35 | 46 | 12 |
| 00:02:10 | 6 | 72% | 35 | 13 | 5 |
| 00:02:20 | 6 | 4% | 54 | 2 | 49 |
| 00:02:30 | 6 | 82% | 55 | 55 | 12 |
| 00:02:40 | 6 | 86% | 55 | 12 | 2 |
| 00:02:50 | 7 | 70% | 55 | 21 | 9 |
| 00:03:00 | 7 | 8% | 55 | 1 | 11 |
| 00:03:10 | 8 | 33% | 55 | 5 | 10 |
| 00:03:20 | 8 | 79% | 55 | 91 | 24 |
| 00:03:30 | 9 | 29% | 55 | 4 | 10 |
| 00:03:40 | 9 | 83% | 55 | 59 | 12 |
| 00:03:50 | 9 | 73% | 55 | 11 | 4 |
| 00:04:00 | 10 | 55 | 0 | 0 | |
| 00:04:10 | 10 | 77% | 55 | 114 | 35 |
| 00:04:20 | 10 | 78% | 55 | 47 | 13 |
| 00:04:30 | 10 | 80% | 55 | 35 | 9 |
| 00:04:40 | 10 | 77% | 55 | 24 | 7 |
| 00:04:50 | 11 | 0% | 55 | 0 | 11 |
| 00:05:00 | 12 | 0% | 55 | 0 | 14 |
| 00:05:10 | 12 | 0% | 55 | 0 | 4 |
| 00:05:20 | 12 | 35% | 55 | 14 | 26 |
| 00:05:30 | 12 | 50% | 55 | 14 | 14 |
| 00:05:40 | 12 | 42% | 57 | 104 | 144 |
| 00:05:50 | 14 | 10% | 57 | 22 | 191 |
| 00:06:00 | 14 | 23% | 57 | 55 | 181 |
| 00:06:10 | 14 | 12% | 57 | 13 | 99 |
| 00:06:20 | 14 | 5% | 57 | 1 | 18 |
| 00:06:30 | 14 | 72% | 57 | 158 | 60 |
| 00:06:40 | 9 | 7% | 57 | 18 | 230 |
| 00:06:50 | 9 | 82% | 57 | 41 | 9 |
| 00:07:00 | 9 | 72% | 57 | 13 | 5 |
| 00:07:10 | 7 | 46% | 57 | 12 | 14 |
| 00:07:20 | 4 | 61% | 57 | 20 | 13 |
| 00:07:30 | 4 | 20% | 57 | 1 | 4 |
| 00:07:40 | 4 | 55% | 57 | 6 | 5 |
| 00:07:50 | 4 | 0% | 57 | 0 | 2 |
| 00:08:00 | 3 | 0% | 57 | 0 | 6 |
| 00:08:10 | 3 | 0% | 57 | 0 | 4 |
| 00:08:20 | 0 |
This section cannot be printed because one or more servers monitored in the test were monitored with a demo license.
To enable printing of this section, you must obtain a full license for server monitoring -- please contact the sales staff at Web Performance.=======