| Load Test Report | |
| 50 + 50 up to 300 |
Servers
The Servers section presents an analysis of each server involved in the load test.
Summary
Server Coverage
These servers/hosts were monitored or used in testcases. The table describes how the server/host was used in the test.
| Server name / host name | # Testcases1 | # Pages2 | # URLs3 | Monitoring4 |
| issuetracker | 1 | 7 | 24 | none |
| ISSUETRACKER.webperformance.com | 0 | 0 | 0 | Advanced |
- # Testcases indicates the number of testcases that include at least one transaction from this server.
- # Pages indicates the number of web pages that are retrieved from this server.
- # URLs indicates the number of urls that are retrieved from this server.
- Advanced, basic or demo.
Peak server metrics
This section summarizes the peak values for key performance metrics for each monitored server.
| Server name | CPU % | Memory % | Disk % | Network Out |
| ISSUETRACKER.webperformance.com | 92% | 17% | 36% | 36.2 Mbps |
Checklist
This checklist highlights key performance metrics for each monitored server along with recommended limits. Warning icons indicate metrics that could be a factor in performance problems and should be investigated.
Server performance checklist: ISSUETRACKER.webperformance.com
| Group/Metric name | Value | Advice | ||||||
 |
CPU | |||||||
|
CPU % | 92 | Consistently exceeding 85% could indicate a bottleneck | |||||
|
Process Queue Length | 28 | Queue length should not exceed 2 per processor | |||||
| Context switches/Sec | 6,622 | Exceeding 15,000 switches/sec can degrade performance | ||||||
|
Memory | |||||||
| Memory % | 17 | Memory usage in excess of 80% can impact performance | ||||||
|
Page reads/sec | 101 | Exceeding 5 could indicate a memory shortage | |||||
| Disk | ||||||||
| Disk I/O Time % | 36 | Disk usage in excess of 95% should be investigated | ||||||
| Disk Queue Length | 0 | Queue length should not exceed 3 (2 + # spindles) | ||||||
| Avg Disk Service Time (ms) | 3 | Greater than 18ms indicates disk optimization is recommended | ||||||
| Network | ||||||||
| TCP Connection Failures | 0 | More than 0 connection failures could result in user errors | ||||||
Server Analysis: ISSUETRACKER.webperformance.com
This section provides a summary of server performance for server ISSUETRACKER.webperformance.com in each group of performance metrics.
Summary: ISSUETRACKER.webperformance.com
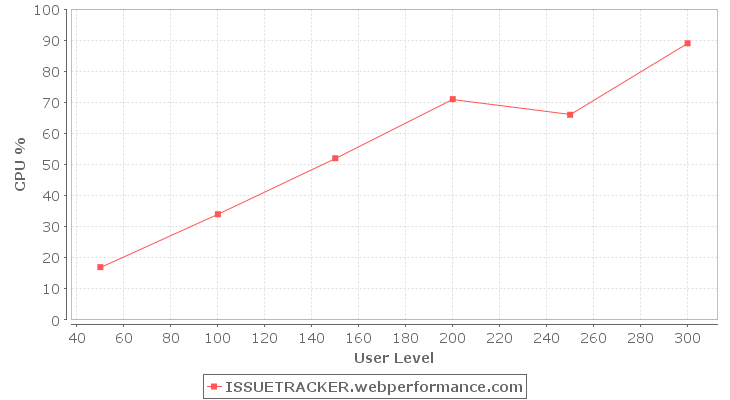
User Level Analysis
Learn more about User Level Analysis by watching the User Level Analysis screencast
![]()
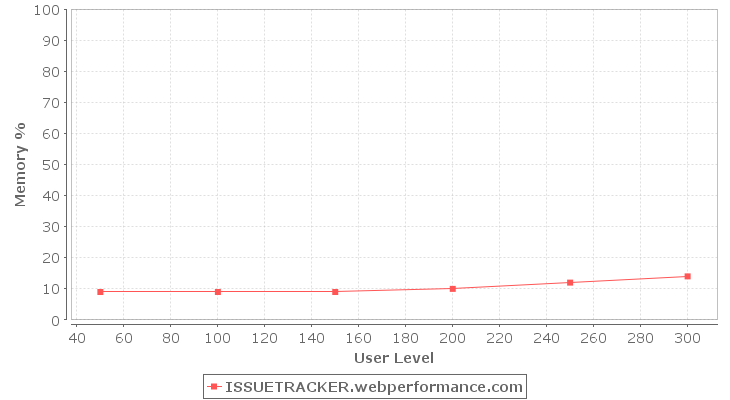
| User Level | CPU % | Memory % | Disk I/O Time % | Bandwidth Out |
| 50 | 17% | 9% | 1% | 7.7 Mbps |
| 100 | 34% | 9% | 1% | 15.4 Mbps |
| 150 | 52% | 9% | 1% | 22.2 Mbps |
| 200 | 71% | 10% | 1% | 28.5 Mbps |
| 250 | 66% | 12% | 1% | 22.9 Mbps |
| 300 | 89% | 14% | 1% | 31.6 Mbps |

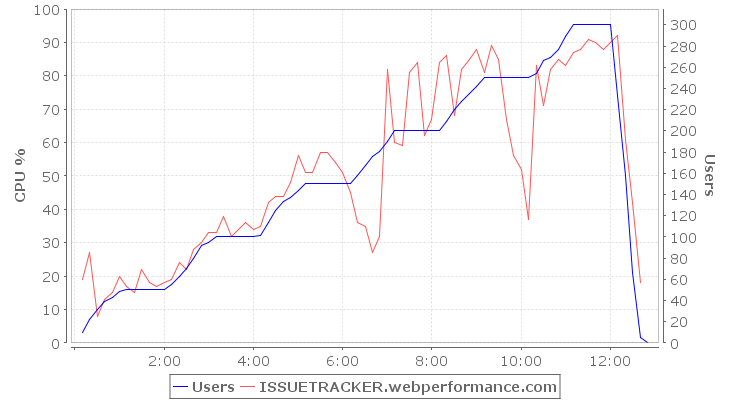
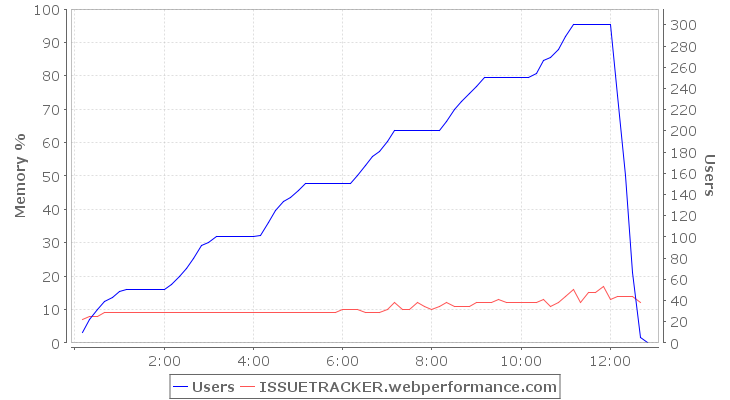
Time-based Analysis
![]()
| Time | Users | CPU % | Memory % | Disk I/O Time % | Bandwidth Out |
| 00:00:10 | 10 | 19% | 7% | 36% | 39.2 kbps |
| 00:00:20 | 22 | 27% | 8% | 13% | 4.5 Mbps |
| 00:00:30 | 32 | 8% | 8% | 2% | 3.8 Mbps |
| 00:00:40 | 39 | 13% | 9% | 1% | 6.0 Mbps |
| 00:00:50 | 43 | 15% | 9% | 3% | 5.4 Mbps |
| 00:01:00 | 49 | 20% | 9% | 1% | 8.7 Mbps |
| 00:01:10 | 50 | 17% | 9% | 3% | 7.8 Mbps |
| 00:01:20 | 50 | 15% | 9% | 1% | 6.9 Mbps |
| 00:01:30 | 50 | 22% | 9% | 2% | 8.4 Mbps |
| 00:01:40 | 50 | 18% | 9% | 1% | 7.5 Mbps |
| 00:01:50 | 50 | 17% | 9% | 1% | 8.2 Mbps |
| 00:02:00 | 50 | 18% | 9% | 1% | 7.7 Mbps |
| 00:02:10 | 55 | 19% | 9% | 1% | 8.4 Mbps |
| 00:02:20 | 63 | 24% | 9% | 1% | 10.2 Mbps |
| 00:02:30 | 70 | 22% | 9% | 1% | 10.4 Mbps |
| 00:02:40 | 80 | 28% | 9% | 1% | 13.1 Mbps |
| 00:02:50 | 92 | 30% | 9% | 1% | 13.8 Mbps |
| 00:03:00 | 95 | 33% | 9% | 1% | 15.3 Mbps |
| 00:03:10 | 100 | 33% | 9% | 1% | 14.9 Mbps |
| 00:03:20 | 100 | 38% | 9% | 1% | 16.2 Mbps |
| 00:03:30 | 100 | 32% | 9% | 1% | 15.2 Mbps |
| 00:03:40 | 100 | 34% | 9% | 1% | 14.5 Mbps |
| 00:03:50 | 100 | 36% | 9% | 1% | 16.2 Mbps |
| 00:04:00 | 100 | 34% | 9% | 1% | 15.5 Mbps |
| 00:04:10 | 101 | 35% | 9% | 1% | 15.8 Mbps |
| 00:04:20 | 114 | 42% | 9% | 1% | 17.0 Mbps |
| 00:04:30 | 125 | 44% | 9% | 1% | 18.7 Mbps |
| 00:04:40 | 133 | 44% | 9% | 1% | 20.5 Mbps |
| 00:04:50 | 137 | 48% | 9% | 1% | 21.1 Mbps |
| 00:05:00 | 144 | 56% | 9% | 3% | 23.1 Mbps |
| 00:05:10 | 150 | 51% | 9% | 1% | 22.7 Mbps |
| 00:05:20 | 150 | 51% | 9% | 1% | 22.3 Mbps |
| 00:05:30 | 150 | 57% | 9% | 1% | 22.8 Mbps |
| 00:05:40 | 150 | 57% | 9% | 3% | 23.7 Mbps |
| 00:05:50 | 150 | 54% | 9% | 1% | 24.5 Mbps |
| 00:06:00 | 150 | 51% | 10% | 1% | 22.1 Mbps |
| 00:06:10 | 150 | 45% | 10% | 1% | 17.4 Mbps |
| 00:06:20 | 158 | 36% | 10% | 1% | 12.8 Mbps |
| 00:06:30 | 167 | 35% | 9% | 1% | 10.4 Mbps |
| 00:06:40 | 176 | 27% | 9% | 1% | 9.3 Mbps |
| 00:06:50 | 181 | 32% | 9% | 1% | 9.9 Mbps |
| 00:07:00 | 190 | 82% | 10% | 1% | 31.0 Mbps |
| 00:07:10 | 200 | 60% | 12% | 1% | 31.5 Mbps |
| 00:07:20 | 200 | 59% | 10% | 2% | 25.4 Mbps |
| 00:07:30 | 200 | 81% | 10% | 2% | 24.6 Mbps |
| 00:07:40 | 200 | 84% | 12% | 1% | 32.4 Mbps |
| 00:07:50 | 200 | 62% | 11% | 2% | 31.6 Mbps |
| 00:08:00 | 200 | 67% | 10% | 2% | 26.6 Mbps |
| 00:08:10 | 200 | 84% | 11% | 1% | 27.5 Mbps |
| 00:08:20 | 209 | 86% | 12% | 1% | 36.2 Mbps |
| 00:08:30 | 220 | 68% | 11% | 2% | 30.3 Mbps |
| 00:08:40 | 228 | 82% | 11% | 2% | 30.6 Mbps |
| 00:08:50 | 235 | 85% | 11% | 2% | 32.7 Mbps |
| 00:09:00 | 242 | 88% | 12% | 2% | 35.0 Mbps |
| 00:09:10 | 250 | 81% | 12% | 2% | 32.3 Mbps |
| 00:09:20 | 250 | 89% | 12% | 2% | 33.0 Mbps |
| 00:09:30 | 250 | 85% | 13% | 2% | 28.2 Mbps |
| 00:09:40 | 250 | 67% | 12% | 2% | 24.3 Mbps |
| 00:09:50 | 250 | 56% | 12% | 1% | 18.5 Mbps |
| 00:10:00 | 250 | 52% | 12% | 1% | 14.0 Mbps |
| 00:10:10 | 250 | 37% | 12% | 1% | 9.8 Mbps |
| 00:10:20 | 254 | 83% | 12% | 1% | 31.1 Mbps |
| 00:10:30 | 266 | 71% | 13% | 1% | 35.5 Mbps |
| 00:10:40 | 269 | 82% | 11% | 2% | 31.7 Mbps |
| 00:10:50 | 277 | 85% | 12% | 2% | 25.3 Mbps |
| 00:11:00 | 289 | 83% | 14% | 1% | 28.8 Mbps |
| 00:11:10 | 300 | 87% | 16% | 1% | 31.4 Mbps |
| 00:11:20 | 300 | 88% | 12% | 2% | 33.5 Mbps |
| 00:11:30 | 300 | 91% | 15% | 2% | 33.6 Mbps |
| 00:11:40 | 300 | 90% | 15% | 2% | 30.9 Mbps |
| 00:11:50 | 300 | 88% | 17% | 1% | 26.2 Mbps |
| 00:12:00 | 300 | 90% | 13% | 1% | 34.4 Mbps |
| 00:12:10 | 233 | 92% | 14% | 1% | 36.2 Mbps |
| 00:12:20 | 158 | 61% | 14% | 3% | 23.7 Mbps |
| 00:12:30 | 66 | 42% | 14% | 2% | 12.2 Mbps |
| 00:12:40 | 5 | 18% | 12% | 1% | 2.7 Mbps |
| 00:12:50 | 0 |
Processor: ISSUETRACKER.webperformance.com
User Level Analysis
Learn more about User Level Analysis by watching the User Level Analysis screencast
![]()
| User Level | CPU % | Context switches/Sec | Process Queue Length |
| 50 | 17% | 1,332 | 0 |
| 100 | 34% | 2,040 | 2 |
| 150 | 52% | 2,700 | 5 |
| 200 | 71% | 2,891 | 3 |
| 250 | 66% | 4,168 | 11 |
| 300 | 89% | 2,465 | 12 |
Time-based Analysis
![]()
| Time | Users | CPU % | Context switches/Sec | Process Queue Length |
| 00:00:10 | 10 | 19% | 1,053 | 1 |
| 00:00:20 | 22 | 27% | 1,547 | 0 |
| 00:00:30 | 32 | 8% | 796 | 0 |
| 00:00:40 | 39 | 13% | 949 | 0 |
| 00:00:50 | 43 | 15% | 1,245 | 0 |
| 00:01:00 | 49 | 20% | 1,460 | 1 |
| 00:01:10 | 50 | 17% | 1,358 | 0 |
| 00:01:20 | 50 | 15% | 1,217 | 0 |
| 00:01:30 | 50 | 22% | 1,649 | 0 |
| 00:01:40 | 50 | 18% | 1,209 | 0 |
| 00:01:50 | 50 | 17% | 1,219 | 0 |
| 00:02:00 | 50 | 18% | 1,342 | 0 |
| 00:02:10 | 55 | 19% | 1,348 | 7 |
| 00:02:20 | 63 | 24% | 1,453 | 1 |
| 00:02:30 | 70 | 22% | 1,574 | 0 |
| 00:02:40 | 80 | 28% | 1,674 | 6 |
| 00:02:50 | 92 | 30% | 1,850 | 0 |
| 00:03:00 | 95 | 33% | 1,971 | 1 |
| 00:03:10 | 100 | 33% | 1,992 | 8 |
| 00:03:20 | 100 | 38% | 2,142 | 0 |
| 00:03:30 | 100 | 32% | 1,908 | 4 |
| 00:03:40 | 100 | 34% | 2,028 | 0 |
| 00:03:50 | 100 | 36% | 2,140 | 0 |
| 00:04:00 | 100 | 34% | 2,035 | 0 |
| 00:04:10 | 101 | 35% | 1,985 | 0 |
| 00:04:20 | 114 | 42% | 2,285 | 0 |
| 00:04:30 | 125 | 44% | 2,288 | 2 |
| 00:04:40 | 133 | 44% | 2,369 | 2 |
| 00:04:50 | 137 | 48% | 2,662 | 0 |
| 00:05:00 | 144 | 56% | 2,833 | 7 |
| 00:05:10 | 150 | 51% | 2,640 | 8 |
| 00:05:20 | 150 | 51% | 2,657 | 3 |
| 00:05:30 | 150 | 57% | 2,894 | 8 |
| 00:05:40 | 150 | 57% | 2,869 | 13 |
| 00:05:50 | 150 | 54% | 2,632 | 3 |
| 00:06:00 | 150 | 51% | 2,699 | 0 |
| 00:06:10 | 150 | 45% | 2,513 | 0 |
| 00:06:20 | 158 | 36% | 2,806 | 1 |
| 00:06:30 | 167 | 35% | 3,094 | 7 |
| 00:06:40 | 176 | 27% | 3,075 | 0 |
| 00:06:50 | 181 | 32% | 3,160 | 6 |
| 00:07:00 | 190 | 82% | 2,872 | 9 |
| 00:07:10 | 200 | 60% | 2,128 | 3 |
| 00:07:20 | 200 | 59% | 2,855 | 5 |
| 00:07:30 | 200 | 81% | 3,233 | 2 |
| 00:07:40 | 200 | 84% | 2,783 | 1 |
| 00:07:50 | 200 | 62% | 2,825 | 1 |
| 00:08:00 | 200 | 67% | 3,620 | 2 |
| 00:08:10 | 200 | 84% | 2,796 | 13 |
| 00:08:20 | 209 | 86% | 3,145 | 9 |
| 00:08:30 | 220 | 68% | 3,158 | 3 |
| 00:08:40 | 228 | 82% | 3,451 | 4 |
| 00:08:50 | 235 | 85% | 2,746 | 4 |
| 00:09:00 | 242 | 88% | 2,842 | 9 |
| 00:09:10 | 250 | 81% | 3,051 | 3 |
| 00:09:20 | 250 | 89% | 2,593 | 9 |
| 00:09:30 | 250 | 85% | 2,726 | 8 |
| 00:09:40 | 250 | 67% | 4,453 | 1 |
| 00:09:50 | 250 | 56% | 6,367 | 28 |
| 00:10:00 | 250 | 52% | 6,622 | 25 |
| 00:10:10 | 250 | 37% | 3,366 | 6 |
| 00:10:20 | 254 | 83% | 2,361 | 3 |
| 00:10:30 | 266 | 71% | 2,606 | 0 |
| 00:10:40 | 269 | 82% | 3,158 | 7 |
| 00:10:50 | 277 | 85% | 2,568 | 4 |
| 00:11:00 | 289 | 83% | 2,477 | 1 |
| 00:11:10 | 300 | 87% | 2,229 | 17 |
| 00:11:20 | 300 | 88% | 2,356 | 4 |
| 00:11:30 | 300 | 91% | 2,537 | 8 |
| 00:11:40 | 300 | 90% | 2,487 | 8 |
| 00:11:50 | 300 | 88% | 2,751 | 24 |
| 00:12:00 | 300 | 90% | 2,432 | 12 |
| 00:12:10 | 233 | 92% | 2,538 | 4 |
| 00:12:20 | 158 | 61% | 3,986 | 2 |
| 00:12:30 | 66 | 42% | 3,065 | 3 |
| 00:12:40 | 5 | 18% | 1,423 | 0 |
| 00:12:50 | 0 |
Memory: ISSUETRACKER.webperformance.com
User Level Analysis
Learn more about User Level Analysis by watching the User Level Analysis screencast
![]()
| User Level | Memory % | Page reads/sec | Page writes/sec |
| 50 | 9% | .07 | .00 |
| 100 | 9% | .07 | .00 |
| 150 | 9% | .03 | .00 |
| 200 | 10% | .19 | .00 |
| 250 | 12% | .09 | .00 |
| 300 | 14% | .02 | .00 |
Time-based Analysis
![]()
| Time | Users | Memory % | Page reads/sec | Page writes/sec |
| 00:00:10 | 10 | 7% | 101.41 | .00 |
| 00:00:20 | 22 | 8% | 48.58 | .00 |
| 00:00:30 | 32 | 8% | 3.30 | .00 |
| 00:00:40 | 39 | 9% | 3.41 | .00 |
| 00:00:50 | 43 | 9% | 1.00 | .00 |
| 00:01:00 | 49 | 9% | .00 | .00 |
| 00:01:10 | 50 | 9% | .20 | .00 |
| 00:01:20 | 50 | 9% | .00 | .00 |
| 00:01:30 | 50 | 9% | .20 | .00 |
| 00:01:40 | 50 | 9% | .00 | .00 |
| 00:01:50 | 50 | 9% | .00 | .00 |
| 00:02:00 | 50 | 9% | .00 | .00 |
| 00:02:10 | 55 | 9% | .10 | .00 |
| 00:02:20 | 63 | 9% | .10 | .00 |
| 00:02:30 | 70 | 9% | .00 | .00 |
| 00:02:40 | 80 | 9% | .00 | .00 |
| 00:02:50 | 92 | 9% | 1.10 | .00 |
| 00:03:00 | 95 | 9% | .00 | .00 |
| 00:03:10 | 100 | 9% | .30 | .00 |
| 00:03:20 | 100 | 9% | .00 | .00 |
| 00:03:30 | 100 | 9% | .00 | .00 |
| 00:03:40 | 100 | 9% | .10 | .00 |
| 00:03:50 | 100 | 9% | .00 | .00 |
| 00:04:00 | 100 | 9% | .00 | .00 |
| 00:04:10 | 101 | 9% | .20 | .00 |
| 00:04:20 | 114 | 9% | .00 | .00 |
| 00:04:30 | 125 | 9% | .00 | .00 |
| 00:04:40 | 133 | 9% | .00 | .00 |
| 00:04:50 | 137 | 9% | .00 | .00 |
| 00:05:00 | 144 | 9% | .60 | .00 |
| 00:05:10 | 150 | 9% | .20 | .00 |
| 00:05:20 | 150 | 9% | .00 | .00 |
| 00:05:30 | 150 | 9% | .00 | .00 |
| 00:05:40 | 150 | 9% | .00 | .00 |
| 00:05:50 | 150 | 9% | .00 | .00 |
| 00:06:00 | 150 | 10% | .00 | .00 |
| 00:06:10 | 150 | 10% | .00 | .00 |
| 00:06:20 | 158 | 10% | .00 | .00 |
| 00:06:30 | 167 | 9% | .00 | .00 |
| 00:06:40 | 176 | 9% | .00 | .00 |
| 00:06:50 | 181 | 9% | .00 | .00 |
| 00:07:00 | 190 | 10% | .00 | .00 |
| 00:07:10 | 200 | 12% | .30 | .00 |
| 00:07:20 | 200 | 10% | .00 | .00 |
| 00:07:30 | 200 | 10% | .00 | .00 |
| 00:07:40 | 200 | 12% | .00 | .00 |
| 00:07:50 | 200 | 11% | 1.00 | .00 |
| 00:08:00 | 200 | 10% | .00 | .00 |
| 00:08:10 | 200 | 11% | .00 | .00 |
| 00:08:20 | 209 | 12% | .00 | .00 |
| 00:08:30 | 220 | 11% | .10 | .00 |
| 00:08:40 | 228 | 11% | .10 | .00 |
| 00:08:50 | 235 | 11% | .00 | .00 |
| 00:09:00 | 242 | 12% | .00 | .00 |
| 00:09:10 | 250 | 12% | .00 | .00 |
| 00:09:20 | 250 | 12% | .00 | .00 |
| 00:09:30 | 250 | 13% | .60 | .00 |
| 00:09:40 | 250 | 12% | .00 | .00 |
| 00:09:50 | 250 | 12% | .00 | .00 |
| 00:10:00 | 250 | 12% | .00 | .00 |
| 00:10:10 | 250 | 12% | .00 | .00 |
| 00:10:20 | 254 | 12% | .00 | .00 |
| 00:10:30 | 266 | 13% | .00 | .00 |
| 00:10:40 | 269 | 11% | .00 | .00 |
| 00:10:50 | 277 | 12% | .00 | .00 |
| 00:11:00 | 289 | 14% | .00 | .00 |
| 00:11:10 | 300 | 16% | .00 | .00 |
| 00:11:20 | 300 | 12% | .00 | .00 |
| 00:11:30 | 300 | 15% | .00 | .00 |
| 00:11:40 | 300 | 15% | .00 | .00 |
| 00:11:50 | 300 | 17% | .10 | .00 |
| 00:12:00 | 300 | 13% | .00 | .00 |
| 00:12:10 | 233 | 14% | .00 | .00 |
| 00:12:20 | 158 | 14% | .10 | .00 |
| 00:12:30 | 66 | 14% | .00 | .00 |
| 00:12:40 | 5 | 12% | .00 | .00 |
| 00:12:50 | 0 |
Disk Utilization: ISSUETRACKER.webperformance.com
User Level Analysis
Learn more about User Level Analysis by watching the User Level Analysis screencast
![]()
| User Level | Disk I/O Time % | Avg Disk Service Time (ms) | Disk Queue Length | Disk Reads/sec | Disk Writes/sec |
| 50 | 1% | 1.02 | 0 | .1 | 8.6 |
| 100 | 1% | .39 | 0 | .1 | 12.0 |
| 150 | 1% | .54 | 0 | .0 | 16.3 |
| 200 | 1% | .41 | 0 | .2 | 21.4 |
| 250 | 1% | .42 | 0 | .1 | 16.3 |
| 300 | 1% | .47 | 0 | .0 | 20.4 |
Time-based Analysis
![]()
| Time | Users | Disk I/O Time % | Avg Disk Service Time (ms) | Disk Queue Length | Disk Reads/sec | Disk Writes/sec |
| 00:00:10 | 10 | 36% | 3.74 | 0 | 111.6 | 3.0 |
| 00:00:20 | 22 | 13% | 1.85 | 0 | 63.8 | 11.3 |
| 00:00:30 | 32 | 2% | 1.34 | 0 | 3.8 | 8.2 |
| 00:00:40 | 39 | 1% | 1.17 | 0 | 4.2 | 4.7 |
| 00:00:50 | 43 | 3% | 3.89 | 0 | 1.2 | 5.6 |
| 00:01:00 | 49 | 1% | .35 | 0 | .0 | 3.6 |
| 00:01:10 | 50 | 3% | 2.18 | 0 | .3 | 8.9 |
| 00:01:20 | 50 | 1% | .28 | 0 | .1 | 8.0 |
| 00:01:30 | 50 | 2% | 1.81 | 0 | .2 | 16.4 |
| 00:01:40 | 50 | 1% | 1.13 | 0 | .0 | 7.0 |
| 00:01:50 | 50 | 1% | .38 | 0 | .0 | 6.7 |
| 00:02:00 | 50 | 1% | .34 | 0 | .0 | 4.8 |
| 00:02:10 | 55 | 1% | .48 | 0 | .2 | 7.9 |
| 00:02:20 | 63 | 1% | .37 | 0 | .1 | 7.7 |
| 00:02:30 | 70 | 1% | .84 | 0 | .0 | 9.4 |
| 00:02:40 | 80 | 1% | .36 | 0 | .0 | 6.5 |
| 00:02:50 | 92 | 1% | .54 | 0 | 1.1 | 7.8 |
| 00:03:00 | 95 | 1% | .49 | 0 | .0 | 11.2 |
| 00:03:10 | 100 | 1% | .55 | 0 | .3 | 13.8 |
| 00:03:20 | 100 | 1% | .34 | 0 | .0 | 12.6 |
| 00:03:30 | 100 | 1% | .33 | 0 | .0 | 13.5 |
| 00:03:40 | 100 | 1% | .38 | 0 | .1 | 10.9 |
| 00:03:50 | 100 | 1% | .37 | 0 | .0 | 9.6 |
| 00:04:00 | 100 | 1% | .33 | 0 | .0 | 11.6 |
| 00:04:10 | 101 | 1% | .49 | 0 | .3 | 10.9 |
| 00:04:20 | 114 | 1% | .34 | 0 | .0 | 15.4 |
| 00:04:30 | 125 | 1% | .37 | 0 | .0 | 10.3 |
| 00:04:40 | 133 | 1% | .39 | 0 | .0 | 11.2 |
| 00:04:50 | 137 | 1% | .43 | 0 | .0 | 17.2 |
| 00:05:00 | 144 | 3% | 1.40 | 0 | .7 | 13.4 |
| 00:05:10 | 150 | 1% | .52 | 0 | .2 | 15.4 |
| 00:05:20 | 150 | 1% | .34 | 0 | .0 | 17.2 |
| 00:05:30 | 150 | 1% | .32 | 0 | .0 | 18.3 |
| 00:05:40 | 150 | 3% | 1.48 | 0 | .0 | 14.0 |
| 00:05:50 | 150 | 1% | .45 | 0 | .0 | 16.7 |
| 00:06:00 | 150 | 1% | .36 | 0 | .0 | 16.0 |
| 00:06:10 | 150 | 1% | .35 | 0 | .0 | 16.5 |
| 00:06:20 | 158 | 1% | .34 | 0 | .0 | 13.9 |
| 00:06:30 | 167 | 1% | .52 | 0 | .0 | 7.0 |
| 00:06:40 | 176 | 1% | .36 | 0 | .0 | .7 |
| 00:06:50 | 181 | 1% | .36 | 0 | .0 | 1.2 |
| 00:07:00 | 190 | 1% | .53 | 0 | .0 | .9 |
| 00:07:10 | 200 | 1% | .41 | 0 | .3 | 20.6 |
| 00:07:20 | 200 | 2% | .37 | 0 | .0 | 34.2 |
| 00:07:30 | 200 | 2% | .44 | 0 | .0 | 21.1 |
| 00:07:40 | 200 | 1% | .42 | 0 | .0 | 10.7 |
| 00:07:50 | 200 | 2% | .54 | 0 | 1.1 | 17.4 |
| 00:08:00 | 200 | 2% | .34 | 0 | .0 | 26.8 |
| 00:08:10 | 200 | 1% | .32 | 0 | .0 | 19.1 |
| 00:08:20 | 209 | 1% | .38 | 0 | .0 | 14.7 |
| 00:08:30 | 220 | 2% | .42 | 0 | .1 | 24.2 |
| 00:08:40 | 228 | 2% | .51 | 0 | .1 | 25.0 |
| 00:08:50 | 235 | 2% | .56 | 0 | .0 | 18.4 |
| 00:09:00 | 242 | 2% | .52 | 0 | .0 | 19.1 |
| 00:09:10 | 250 | 2% | .48 | 0 | .0 | 24.0 |
| 00:09:20 | 250 | 2% | .48 | 0 | .0 | 26.9 |
| 00:09:30 | 250 | 2% | .51 | 0 | .7 | 17.2 |
| 00:09:40 | 250 | 2% | .41 | 0 | .0 | 22.3 |
| 00:09:50 | 250 | 1% | .37 | 0 | .0 | 13.9 |
| 00:10:00 | 250 | 1% | .40 | 0 | .0 | 8.5 |
| 00:10:10 | 250 | 1% | .29 | 0 | .0 | 1.5 |
| 00:10:20 | 254 | 1% | .24 | 0 | .0 | 6.6 |
| 00:10:30 | 266 | 1% | .38 | 0 | .0 | 14.7 |
| 00:10:40 | 269 | 2% | .45 | 0 | .0 | 31.2 |
| 00:10:50 | 277 | 2% | .45 | 0 | .0 | 22.5 |
| 00:11:00 | 289 | 1% | .51 | 0 | .0 | 12.3 |
| 00:11:10 | 300 | 1% | .40 | 0 | .0 | 14.9 |
| 00:11:20 | 300 | 2% | .42 | 0 | .0 | 24.9 |
| 00:11:30 | 300 | 2% | .42 | 0 | .0 | 27.1 |
| 00:11:40 | 300 | 2% | .59 | 0 | .0 | 22.1 |
| 00:11:50 | 300 | 1% | .52 | 0 | .1 | 15.3 |
| 00:12:00 | 300 | 1% | .47 | 0 | .0 | 18.2 |
| 00:12:10 | 233 | 1% | .32 | 0 | .0 | 21.5 |
| 00:12:20 | 158 | 3% | .83 | 0 | .1 | 30.0 |
| 00:12:30 | 66 | 2% | .48 | 0 | .0 | 19.0 |
| 00:12:40 | 5 | 1% | .28 | 0 | .0 | 8.7 |
| 00:12:50 | 0 |
Network Bandwidth: ISSUETRACKER.webperformance.com
User Level Analysis
Learn more about User Level Analysis by watching the User Level Analysis screencast
![]()
| User Level | Bandwidth In | Bandwidth Out | Network Packets received/sec | Network Packets sent/sec |
| 50 | 3.3 Mbps | 7.7 Mbps | 719 | 846 |
| 100 | 6.7 Mbps | 15.4 Mbps | 1,437 | 1,695 |
| 150 | 9.5 Mbps | 22.2 Mbps | 2,048 | 2,442 |
| 200 | 12.2 Mbps | 28.5 Mbps | 2,592 | 3,128 |
| 250 | 8.9 Mbps | 22.9 Mbps | 2,170 | 2,604 |
| 300 | 13.7 Mbps | 31.6 Mbps | 2,896 | 3,550 |
Time-based Analysis
![]()
| Time | Users | Bandwidth In | Bandwidth Out | Network Packets received/sec | Network Packets sent/sec |
| 00:00:10 | 10 | 12.9 kbps | 39.2 kbps | 8 | 9 |
| 00:00:20 | 22 | 2.0 Mbps | 4.5 Mbps | 411 | 506 |
| 00:00:30 | 32 | 1.5 Mbps | 3.8 Mbps | 325 | 395 |
| 00:00:40 | 39 | 2.3 Mbps | 6.0 Mbps | 506 | 624 |
| 00:00:50 | 43 | 2.4 Mbps | 5.4 Mbps | 527 | 612 |
| 00:01:00 | 49 | 3.9 Mbps | 8.7 Mbps | 808 | 956 |
| 00:01:10 | 50 | 3.2 Mbps | 7.8 Mbps | 707 | 841 |
| 00:01:20 | 50 | 3.1 Mbps | 6.9 Mbps | 649 | 758 |
| 00:01:30 | 50 | 3.6 Mbps | 8.4 Mbps | 787 | 926 |
| 00:01:40 | 50 | 3.3 Mbps | 7.5 Mbps | 701 | 816 |
| 00:01:50 | 50 | 3.3 Mbps | 8.2 Mbps | 735 | 885 |
| 00:02:00 | 50 | 3.5 Mbps | 7.7 Mbps | 735 | 850 |
| 00:02:10 | 55 | 3.7 Mbps | 8.4 Mbps | 789 | 924 |
| 00:02:20 | 63 | 4.4 Mbps | 10.2 Mbps | 932 | 1,107 |
| 00:02:30 | 70 | 4.5 Mbps | 10.4 Mbps | 966 | 1,138 |
| 00:02:40 | 80 | 5.5 Mbps | 13.1 Mbps | 1,188 | 1,412 |
| 00:02:50 | 92 | 6.0 Mbps | 13.8 Mbps | 1,282 | 1,512 |
| 00:03:00 | 95 | 6.6 Mbps | 15.3 Mbps | 1,387 | 1,652 |
| 00:03:10 | 100 | 6.3 Mbps | 14.9 Mbps | 1,393 | 1,643 |
| 00:03:20 | 100 | 7.2 Mbps | 16.2 Mbps | 1,522 | 1,802 |
| 00:03:30 | 100 | 6.3 Mbps | 15.2 Mbps | 1,379 | 1,635 |
| 00:03:40 | 100 | 6.5 Mbps | 14.5 Mbps | 1,369 | 1,602 |
| 00:03:50 | 100 | 7.2 Mbps | 16.2 Mbps | 1,527 | 1,791 |
| 00:04:00 | 100 | 6.7 Mbps | 15.5 Mbps | 1,436 | 1,698 |
| 00:04:10 | 101 | 6.9 Mbps | 15.8 Mbps | 1,456 | 1,722 |
| 00:04:20 | 114 | 7.7 Mbps | 17.0 Mbps | 1,622 | 1,898 |
| 00:04:30 | 125 | 7.9 Mbps | 18.7 Mbps | 1,719 | 2,043 |
| 00:04:40 | 133 | 8.7 Mbps | 20.5 Mbps | 1,873 | 2,228 |
| 00:04:50 | 137 | 9.1 Mbps | 21.1 Mbps | 1,959 | 2,323 |
| 00:05:00 | 144 | 10.4 Mbps | 23.1 Mbps | 2,160 | 2,556 |
| 00:05:10 | 150 | 9.5 Mbps | 22.7 Mbps | 2,067 | 2,467 |
| 00:05:20 | 150 | 9.5 Mbps | 22.3 Mbps | 2,037 | 2,439 |
| 00:05:30 | 150 | 9.9 Mbps | 22.8 Mbps | 2,148 | 2,538 |
| 00:05:40 | 150 | 10.7 Mbps | 23.7 Mbps | 2,219 | 2,624 |
| 00:05:50 | 150 | 10.2 Mbps | 24.5 Mbps | 2,205 | 2,652 |
| 00:06:00 | 150 | 9.5 Mbps | 22.1 Mbps | 2,032 | 2,431 |
| 00:06:10 | 150 | 7.2 Mbps | 17.4 Mbps | 1,631 | 1,946 |
| 00:06:20 | 158 | 4.6 Mbps | 12.8 Mbps | 1,292 | 1,492 |
| 00:06:30 | 167 | 3.1 Mbps | 10.4 Mbps | 1,110 | 1,277 |
| 00:06:40 | 176 | 1.5 Mbps | 9.3 Mbps | 928 | 1,106 |
| 00:06:50 | 181 | 1.7 Mbps | 9.9 Mbps | 1,012 | 1,201 |
| 00:07:00 | 190 | 15.5 Mbps | 31.0 Mbps | 2,889 | 3,451 |
| 00:07:10 | 200 | 11.4 Mbps | 31.5 Mbps | 2,437 | 3,135 |
| 00:07:20 | 200 | 10.1 Mbps | 25.4 Mbps | 2,260 | 2,747 |
| 00:07:30 | 200 | 12.7 Mbps | 24.6 Mbps | 2,632 | 2,988 |
| 00:07:40 | 200 | 14.0 Mbps | 32.4 Mbps | 2,923 | 3,576 |
| 00:07:50 | 200 | 12.1 Mbps | 31.6 Mbps | 2,632 | 3,280 |
| 00:08:00 | 200 | 11.2 Mbps | 26.6 Mbps | 2,468 | 2,950 |
| 00:08:10 | 200 | 13.8 Mbps | 27.5 Mbps | 2,794 | 3,223 |
| 00:08:20 | 209 | 15.3 Mbps | 36.2 Mbps | 3,179 | 3,899 |
| 00:08:30 | 220 | 12.1 Mbps | 30.3 Mbps | 2,637 | 3,236 |
| 00:08:40 | 228 | 13.6 Mbps | 30.6 Mbps | 2,911 | 3,468 |
| 00:08:50 | 235 | 15.1 Mbps | 32.7 Mbps | 3,095 | 3,688 |
| 00:09:00 | 242 | 14.9 Mbps | 35.0 Mbps | 3,134 | 3,821 |
| 00:09:10 | 250 | 13.5 Mbps | 32.3 Mbps | 2,899 | 3,530 |
| 00:09:20 | 250 | 14.4 Mbps | 33.0 Mbps | 3,050 | 3,704 |
| 00:09:30 | 250 | 13.1 Mbps | 28.2 Mbps | 2,715 | 3,214 |
| 00:09:40 | 250 | 8.1 Mbps | 24.3 Mbps | 2,166 | 2,689 |
| 00:09:50 | 250 | 6.0 Mbps | 18.5 Mbps | 1,853 | 2,171 |
| 00:10:00 | 250 | 4.0 Mbps | 14.0 Mbps | 1,508 | 1,729 |
| 00:10:10 | 250 | 3.4 Mbps | 9.8 Mbps | 1,002 | 1,193 |
| 00:10:20 | 254 | 14.3 Mbps | 31.1 Mbps | 2,753 | 3,410 |
| 00:10:30 | 266 | 13.7 Mbps | 35.5 Mbps | 2,816 | 3,668 |
| 00:10:40 | 269 | 13.8 Mbps | 31.7 Mbps | 2,888 | 3,527 |
| 00:10:50 | 277 | 12.3 Mbps | 25.3 Mbps | 2,589 | 3,046 |
| 00:11:00 | 289 | 13.7 Mbps | 28.8 Mbps | 2,711 | 3,276 |
| 00:11:10 | 300 | 13.6 Mbps | 31.4 Mbps | 2,779 | 3,437 |
| 00:11:20 | 300 | 13.8 Mbps | 33.5 Mbps | 2,914 | 3,654 |
| 00:11:30 | 300 | 13.9 Mbps | 33.6 Mbps | 3,047 | 3,770 |
| 00:11:40 | 300 | 14.0 Mbps | 30.9 Mbps | 2,912 | 3,527 |
| 00:11:50 | 300 | 12.4 Mbps | 26.2 Mbps | 2,652 | 3,110 |
| 00:12:00 | 300 | 14.6 Mbps | 34.4 Mbps | 3,073 | 3,803 |
| 00:12:10 | 233 | 15.6 Mbps | 36.2 Mbps | 3,167 | 3,917 |
| 00:12:20 | 158 | 9.9 Mbps | 23.7 Mbps | 2,169 | 2,616 |
| 00:12:30 | 66 | 6.3 Mbps | 12.2 Mbps | 1,320 | 1,490 |
| 00:12:40 | 5 | 2.3 Mbps | 2.7 Mbps | 429 | 419 |
| 00:12:50 | 0 |
Connections: ISSUETRACKER.webperformance.com
User Level Analysis
Learn more about User Level Analysis by watching the User Level Analysis screencast
![]()
| User Level | TCP Connections Established | TCP Connection Failures |
| 50 | 119 | 0 |
| 100 | 216 | 0 |
| 150 | 314 | 0 |
| 200 | 428 | 0 |
| 250 | 457 | 0 |
| 300 | 555 | 0 |
Time-based Analysis
![]()
| Time | Users | TCP Connections Established | TCP Connection Failures |
| 00:00:10 | 10 | 18 | 0 |
| 00:00:20 | 22 | 69 | 0 |
| 00:00:30 | 32 | 87 | 0 |
| 00:00:40 | 39 | 101 | 0 |
| 00:00:50 | 43 | 99 | 0 |
| 00:01:00 | 49 | 118 | 0 |
| 00:01:10 | 50 | 122 | 0 |
| 00:01:20 | 50 | 117 | 0 |
| 00:01:30 | 50 | 121 | 0 |
| 00:01:40 | 50 | 119 | 0 |
| 00:01:50 | 50 | 119 | 0 |
| 00:02:00 | 50 | 119 | 0 |
| 00:02:10 | 55 | 129 | 0 |
| 00:02:20 | 63 | 145 | 0 |
| 00:02:30 | 70 | 159 | 0 |
| 00:02:40 | 80 | 179 | 0 |
| 00:02:50 | 92 | 201 | 0 |
| 00:03:00 | 95 | 211 | 0 |
| 00:03:10 | 100 | 221 | 0 |
| 00:03:20 | 100 | 211 | 0 |
| 00:03:30 | 100 | 221 | 0 |
| 00:03:40 | 100 | 213 | 0 |
| 00:03:50 | 100 | 215 | 0 |
| 00:04:00 | 100 | 215 | 0 |
| 00:04:10 | 101 | 213 | 0 |
| 00:04:20 | 114 | 247 | 0 |
| 00:04:30 | 125 | 269 | 0 |
| 00:04:40 | 133 | 283 | 0 |
| 00:04:50 | 137 | 291 | 0 |
| 00:05:00 | 144 | 300 | 0 |
| 00:05:10 | 150 | 318 | 0 |
| 00:05:20 | 150 | 319 | 0 |
| 00:05:30 | 150 | 313 | 0 |
| 00:05:40 | 150 | 314 | 0 |
| 00:05:50 | 150 | 319 | 0 |
| 00:06:00 | 150 | 311 | 0 |
| 00:06:10 | 150 | 305 | 0 |
| 00:06:20 | 158 | 300 | 0 |
| 00:06:30 | 167 | 282 | 0 |
| 00:06:40 | 176 | 307 | 0 |
| 00:06:50 | 181 | 381 | 0 |
| 00:07:00 | 190 | 410 | 0 |
| 00:07:10 | 200 | 433 | 0 |
| 00:07:20 | 200 | 417 | 0 |
| 00:07:30 | 200 | 419 | 0 |
| 00:07:40 | 200 | 437 | 0 |
| 00:07:50 | 200 | 437 | 0 |
| 00:08:00 | 200 | 427 | 0 |
| 00:08:10 | 200 | 428 | 0 |
| 00:08:20 | 209 | 456 | 0 |
| 00:08:30 | 220 | 473 | 0 |
| 00:08:40 | 228 | 479 | 0 |
| 00:08:50 | 235 | 488 | 0 |
| 00:09:00 | 242 | 521 | 0 |
| 00:09:10 | 250 | 530 | 0 |
| 00:09:20 | 250 | 517 | 0 |
| 00:09:30 | 250 | 545 | 0 |
| 00:09:40 | 250 | 505 | 0 |
| 00:09:50 | 250 | 472 | 0 |
| 00:10:00 | 250 | 435 | 0 |
| 00:10:10 | 250 | 197 | 0 |
| 00:10:20 | 254 | 303 | 0 |
| 00:10:30 | 266 | 345 | 0 |
| 00:10:40 | 269 | 397 | 0 |
| 00:10:50 | 277 | 429 | 0 |
| 00:11:00 | 289 | 464 | 0 |
| 00:11:10 | 300 | 491 | 0 |
| 00:11:20 | 300 | 507 | 0 |
| 00:11:30 | 300 | 519 | 0 |
| 00:11:40 | 300 | 519 | 0 |
| 00:11:50 | 300 | 637 | 0 |
| 00:12:00 | 300 | 661 | 0 |
| 00:12:10 | 233 | 531 | 0 |
| 00:12:20 | 158 | 383 | 0 |
| 00:12:30 | 66 | 195 | 0 |
| 00:12:40 | 5 | 79 | 0 |
| 00:12:50 | 0 |
Network Errors: ISSUETRACKER.webperformance.com
User Level Analysis
Learn more about User Level Analysis by watching the User Level Analysis screencast
![]()
| User Level | Network Packets Received Errors | Network Packets Sent Errors | TCP Segments Retransmitted/sec |
| 50 | 0 | 0 | 55.0 |
| 100 | 0 | 0 | 98.5 |
| 150 | 0 | 0 | 147.0 |
| 200 | 0 | 0 | 189.5 |
| 250 | 0 | 0 | 124.5 |
| 300 | 0 | 0 | 163.9 |
Time-based Analysis
![]()
| Time | Users | Network Packets Received Errors | Network Packets Sent Errors | TCP Segments Retransmitted/sec |
| 00:00:10 | 10 | 0 | 0 | .0 |
| 00:00:20 | 22 | 0 | 0 | 19.9 |
| 00:00:30 | 32 | 0 | 0 | 33.6 |
| 00:00:40 | 39 | 0 | 0 | 56.5 |
| 00:00:50 | 43 | 0 | 0 | 29.1 |
| 00:01:00 | 49 | 0 | 0 | 53.4 |
| 00:01:10 | 50 | 0 | 0 | 49.7 |
| 00:01:20 | 50 | 0 | 0 | 44.4 |
| 00:01:30 | 50 | 0 | 0 | 56.2 |
| 00:01:40 | 50 | 0 | 0 | 54.6 |
| 00:01:50 | 50 | 0 | 0 | 74.4 |
| 00:02:00 | 50 | 0 | 0 | 51.0 |
| 00:02:10 | 55 | 0 | 0 | 51.9 |
| 00:02:20 | 63 | 0 | 0 | 55.4 |
| 00:02:30 | 70 | 0 | 0 | 65.2 |
| 00:02:40 | 80 | 0 | 0 | 114.4 |
| 00:02:50 | 92 | 0 | 0 | 76.5 |
| 00:03:00 | 95 | 0 | 0 | 89.5 |
| 00:03:10 | 100 | 0 | 0 | 112.9 |
| 00:03:20 | 100 | 0 | 0 | 110.2 |
| 00:03:30 | 100 | 0 | 0 | 113.9 |
| 00:03:40 | 100 | 0 | 0 | 67.4 |
| 00:03:50 | 100 | 0 | 0 | 98.1 |
| 00:04:00 | 100 | 0 | 0 | 88.4 |
| 00:04:10 | 101 | 0 | 0 | 82.8 |
| 00:04:20 | 114 | 0 | 0 | 85.2 |
| 00:04:30 | 125 | 0 | 0 | 142.6 |
| 00:04:40 | 133 | 0 | 0 | 137.2 |
| 00:04:50 | 137 | 0 | 0 | 141.5 |
| 00:05:00 | 144 | 0 | 0 | 138.2 |
| 00:05:10 | 150 | 0 | 0 | 184.6 |
| 00:05:20 | 150 | 0 | 0 | 133.2 |
| 00:05:30 | 150 | 0 | 0 | 145.3 |
| 00:05:40 | 150 | 0 | 0 | 154.7 |
| 00:05:50 | 150 | 0 | 0 | 173.0 |
| 00:06:00 | 150 | 0 | 0 | 159.9 |
| 00:06:10 | 150 | 0 | 0 | 78.0 |
| 00:06:20 | 158 | 0 | 0 | 48.4 |
| 00:06:30 | 167 | 0 | 0 | 10.4 |
| 00:06:40 | 176 | 0 | 0 | 7.2 |
| 00:06:50 | 181 | 0 | 0 | 10.0 |
| 00:07:00 | 190 | 0 | 0 | 195.4 |
| 00:07:10 | 200 | 0 | 0 | 285.0 |
| 00:07:20 | 200 | 0 | 0 | 160.2 |
| 00:07:30 | 200 | 0 | 0 | 141.1 |
| 00:07:40 | 200 | 0 | 0 | 177.3 |
| 00:07:50 | 200 | 0 | 0 | 264.1 |
| 00:08:00 | 200 | 0 | 0 | 156.2 |
| 00:08:10 | 200 | 0 | 0 | 142.8 |
| 00:08:20 | 209 | 0 | 0 | 216.1 |
| 00:08:30 | 220 | 0 | 0 | 201.1 |
| 00:08:40 | 228 | 0 | 0 | 141.6 |
| 00:08:50 | 235 | 0 | 0 | 178.7 |
| 00:09:00 | 242 | 0 | 0 | 246.2 |
| 00:09:10 | 250 | 0 | 0 | 222.0 |
| 00:09:20 | 250 | 0 | 0 | 207.7 |
| 00:09:30 | 250 | 0 | 0 | 144.7 |
| 00:09:40 | 250 | 0 | 0 | 151.8 |
| 00:09:50 | 250 | 0 | 0 | 58.6 |
| 00:10:00 | 250 | 0 | 0 | 22.6 |
| 00:10:10 | 250 | 0 | 0 | 64.1 |
| 00:10:20 | 254 | 0 | 0 | 244.0 |
| 00:10:30 | 266 | 0 | 0 | 220.4 |
| 00:10:40 | 269 | 0 | 0 | 136.6 |
| 00:10:50 | 277 | 0 | 0 | 86.7 |
| 00:11:00 | 289 | 0 | 0 | 163.1 |
| 00:11:10 | 300 | 0 | 0 | 240.7 |
| 00:11:20 | 300 | 0 | 0 | 139.9 |
| 00:11:30 | 300 | 0 | 0 | 157.0 |
| 00:11:40 | 300 | 0 | 0 | 150.0 |
| 00:11:50 | 300 | 0 | 0 | 131.0 |
| 00:12:00 | 300 | 0 | 0 | 164.7 |
| 00:12:10 | 233 | 0 | 0 | 219.9 |
| 00:12:20 | 158 | 0 | 0 | 133.8 |
| 00:12:30 | 66 | 0 | 0 | 44.7 |
| 00:12:40 | 5 | 0 | 0 | 6.6 |
| 00:12:50 | 0 |
.NET CLR Memory Usage
Detailed metrics for this section were not collected during the test. To collect these metrics, please install or upgrade the Server Monitoring Agent.
.NET CLR Garbage Collection
Detailed metrics for this section were not collected during the test. To collect these metrics, please install or upgrade the Server Monitoring Agent.
.NET CLR Errors
Detailed metrics for this section were not collected during the test. To collect these metrics, please install or upgrade the Server Monitoring Agent.
.NET CLR Locks
Detailed metrics for this section were not collected during the test. To collect these metrics, please install or upgrade the Server Monitoring Agent.
.NET CLR Threads
Detailed metrics for this section were not collected during the test. To collect these metrics, please install or upgrade the Server Monitoring Agent.
.NET CLR Loading
Detailed metrics for this section were not collected during the test. To collect these metrics, please install or upgrade the Server Monitoring Agent.
ASP.NET Request Execution
Detailed metrics for this section were not collected during the test. To collect these metrics, please install or upgrade the Server Monitoring Agent.
ASP.NET Request Queue
Detailed metrics for this section were not collected during the test. To collect these metrics, please install or upgrade the Server Monitoring Agent.
ASP.NET Cache
Detailed metrics for this section were not collected during the test. To collect these metrics, please install or upgrade the Server Monitoring Agent.
ASP.NET Errors
Detailed metrics for this section were not collected during the test. To collect these metrics, please install or upgrade the Server Monitoring Agent.
ASP.NET Application Requests
Detailed metrics for this section were not collected during the test. To collect these metrics, please install or upgrade the Server Monitoring Agent.
ASP.NET Application Request Failures
Detailed metrics for this section were not collected during the test. To collect these metrics, please install or upgrade the Server Monitoring Agent.
ASP.NET Application Errors
Detailed metrics for this section were not collected during the test. To collect these metrics, please install or upgrade the Server Monitoring Agent.
ASP.NET Sessions
Detailed metrics for this section were not collected during the test. To collect these metrics, please install or upgrade the Server Monitoring Agent.
ASP.NET Applications
Detailed metrics for this section were not collected during the test. To collect these metrics, please install or upgrade the Server Monitoring Agent.
IIS Summary
Detailed metrics for this section were not collected during the test. To collect these metrics, please install or upgrade the Server Monitoring Agent.
IIS+App Processor
Detailed metrics for this section were not collected during the test. To collect these metrics, please install or upgrade the Server Monitoring Agent.
IIS Connections
Detailed metrics for this section were not collected during the test. To collect these metrics, please install or upgrade the Server Monitoring Agent.
IIS Requests
Detailed metrics for this section were not collected during the test. To collect these metrics, please install or upgrade the Server Monitoring Agent.
IIS+App Memory
Detailed metrics for this section were not collected during the test. To collect these metrics, please install or upgrade the Server Monitoring Agent.
IIS File Cache
Detailed metrics for this section were not collected during the test. To collect these metrics, please install or upgrade the Server Monitoring Agent.
IIS URI Cache
Detailed metrics for this section were not collected during the test. To collect these metrics, please install or upgrade the Server Monitoring Agent.
IIS Kernel URI Cache
Detailed metrics for this section were not collected during the test. To collect these metrics, please install or upgrade the Server Monitoring Agent.
Detailed Server Metrics
The Individual Metrics section provides charts and graphs for each metric that is collected for the monitored server(s). When multiple servers are monitored and have the same metrics available, they are combined on a single chart for easy comparisons of the server performance.
CPU %
CPU utilization % at end of sample period
User Level Analysis
Learn more about User Level Analysis by watching the User Level Analysis screencast
| User Level | ISSUETRACKER.webperformance.com |
| 50 | 17% |
| 100 | 34% |
| 150 | 52% |
| 200 | 71% |
| 250 | 66% |
| 300 | 89% |
Time-based Analysis
| Time | Users | ISSUETRACKER.webperformance.com |
| 00:00:10 | 10 | 19% |
| 00:00:20 | 22 | 27% |
| 00:00:30 | 32 | 8% |
| 00:00:40 | 39 | 13% |
| 00:00:50 | 43 | 15% |
| 00:01:00 | 49 | 20% |
| 00:01:10 | 50 | 17% |
| 00:01:20 | 50 | 15% |
| 00:01:30 | 50 | 22% |
| 00:01:40 | 50 | 18% |
| 00:01:50 | 50 | 17% |
| 00:02:00 | 50 | 18% |
| 00:02:10 | 55 | 19% |
| 00:02:20 | 63 | 24% |
| 00:02:30 | 70 | 22% |
| 00:02:40 | 80 | 28% |
| 00:02:50 | 92 | 30% |
| 00:03:00 | 95 | 33% |
| 00:03:10 | 100 | 33% |
| 00:03:20 | 100 | 38% |
| 00:03:30 | 100 | 32% |
| 00:03:40 | 100 | 34% |
| 00:03:50 | 100 | 36% |
| 00:04:00 | 100 | 34% |
| 00:04:10 | 101 | 35% |
| 00:04:20 | 114 | 42% |
| 00:04:30 | 125 | 44% |
| 00:04:40 | 133 | 44% |
| 00:04:50 | 137 | 48% |
| 00:05:00 | 144 | 56% |
| 00:05:10 | 150 | 51% |
| 00:05:20 | 150 | 51% |
| 00:05:30 | 150 | 57% |
| 00:05:40 | 150 | 57% |
| 00:05:50 | 150 | 54% |
| 00:06:00 | 150 | 51% |
| 00:06:10 | 150 | 45% |
| 00:06:20 | 158 | 36% |
| 00:06:30 | 167 | 35% |
| 00:06:40 | 176 | 27% |
| 00:06:50 | 181 | 32% |
| 00:07:00 | 190 | 82% |
| 00:07:10 | 200 | 60% |
| 00:07:20 | 200 | 59% |
| 00:07:30 | 200 | 81% |
| 00:07:40 | 200 | 84% |
| 00:07:50 | 200 | 62% |
| 00:08:00 | 200 | 67% |
| 00:08:10 | 200 | 84% |
| 00:08:20 | 209 | 86% |
| 00:08:30 | 220 | 68% |
| 00:08:40 | 228 | 82% |
| 00:08:50 | 235 | 85% |
| 00:09:00 | 242 | 88% |
| 00:09:10 | 250 | 81% |
| 00:09:20 | 250 | 89% |
| 00:09:30 | 250 | 85% |
| 00:09:40 | 250 | 67% |
| 00:09:50 | 250 | 56% |
| 00:10:00 | 250 | 52% |
| 00:10:10 | 250 | 37% |
| 00:10:20 | 254 | 83% |
| 00:10:30 | 266 | 71% |
| 00:10:40 | 269 | 82% |
| 00:10:50 | 277 | 85% |
| 00:11:00 | 289 | 83% |
| 00:11:10 | 300 | 87% |
| 00:11:20 | 300 | 88% |
| 00:11:30 | 300 | 91% |
| 00:11:40 | 300 | 90% |
| 00:11:50 | 300 | 88% |
| 00:12:00 | 300 | 90% |
| 00:12:10 | 233 | 92% |
| 00:12:20 | 158 | 61% |
| 00:12:30 | 66 | 42% |
| 00:12:40 | 5 | 18% |
| 00:12:50 | 0 |
Memory %
Memory utilization % at end of sample period
User Level Analysis
Learn more about User Level Analysis by watching the User Level Analysis screencast
| User Level | ISSUETRACKER.webperformance.com |
| 50 | 9% |
| 100 | 9% |
| 150 | 9% |
| 200 | 10% |
| 250 | 12% |
| 300 | 14% |
Time-based Analysis
| Time | Users | ISSUETRACKER.webperformance.com |
| 00:00:10 | 10 | 7% |
| 00:00:20 | 22 | 8% |
| 00:00:30 | 32 | 8% |
| 00:00:40 | 39 | 9% |
| 00:00:50 | 43 | 9% |
| 00:01:00 | 49 | 9% |
| 00:01:10 | 50 | 9% |
| 00:01:20 | 50 | 9% |
| 00:01:30 | 50 | 9% |
| 00:01:40 | 50 | 9% |
| 00:01:50 | 50 | 9% |
| 00:02:00 | 50 | 9% |
| 00:02:10 | 55 | 9% |
| 00:02:20 | 63 | 9% |
| 00:02:30 | 70 | 9% |
| 00:02:40 | 80 | 9% |
| 00:02:50 | 92 | 9% |
| 00:03:00 | 95 | 9% |
| 00:03:10 | 100 | 9% |
| 00:03:20 | 100 | 9% |
| 00:03:30 | 100 | 9% |
| 00:03:40 | 100 | 9% |
| 00:03:50 | 100 | 9% |
| 00:04:00 | 100 | 9% |
| 00:04:10 | 101 | 9% |
| 00:04:20 | 114 | 9% |
| 00:04:30 | 125 | 9% |
| 00:04:40 | 133 | 9% |
| 00:04:50 | 137 | 9% |
| 00:05:00 | 144 | 9% |
| 00:05:10 | 150 | 9% |
| 00:05:20 | 150 | 9% |
| 00:05:30 | 150 | 9% |
| 00:05:40 | 150 | 9% |
| 00:05:50 | 150 | 9% |
| 00:06:00 | 150 | 10% |
| 00:06:10 | 150 | 10% |
| 00:06:20 | 158 | 10% |
| 00:06:30 | 167 | 9% |
| 00:06:40 | 176 | 9% |
| 00:06:50 | 181 | 9% |
| 00:07:00 | 190 | 10% |
| 00:07:10 | 200 | 12% |
| 00:07:20 | 200 | 10% |
| 00:07:30 | 200 | 10% |
| 00:07:40 | 200 | 12% |
| 00:07:50 | 200 | 11% |
| 00:08:00 | 200 | 10% |
| 00:08:10 | 200 | 11% |
| 00:08:20 | 209 | 12% |
| 00:08:30 | 220 | 11% |
| 00:08:40 | 228 | 11% |
| 00:08:50 | 235 | 11% |
| 00:09:00 | 242 | 12% |
| 00:09:10 | 250 | 12% |
| 00:09:20 | 250 | 12% |
| 00:09:30 | 250 | 13% |
| 00:09:40 | 250 | 12% |
| 00:09:50 | 250 | 12% |
| 00:10:00 | 250 | 12% |
| 00:10:10 | 250 | 12% |
| 00:10:20 | 254 | 12% |
| 00:10:30 | 266 | 13% |
| 00:10:40 | 269 | 11% |
| 00:10:50 | 277 | 12% |
| 00:11:00 | 289 | 14% |
| 00:11:10 | 300 | 16% |
| 00:11:20 | 300 | 12% |
| 00:11:30 | 300 | 15% |
| 00:11:40 | 300 | 15% |
| 00:11:50 | 300 | 17% |
| 00:12:00 | 300 | 13% |
| 00:12:10 | 233 | 14% |
| 00:12:20 | 158 | 14% |
| 00:12:30 | 66 | 14% |
| 00:12:40 | 5 | 12% |
| 00:12:50 | 0 |
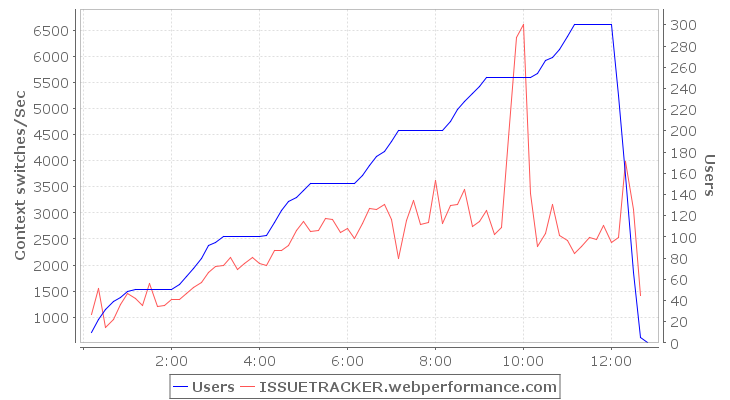
Context switches/Sec
Rate of context switches from one thread to another
User Level Analysis
Learn more about User Level Analysis by watching the User Level Analysis screencast
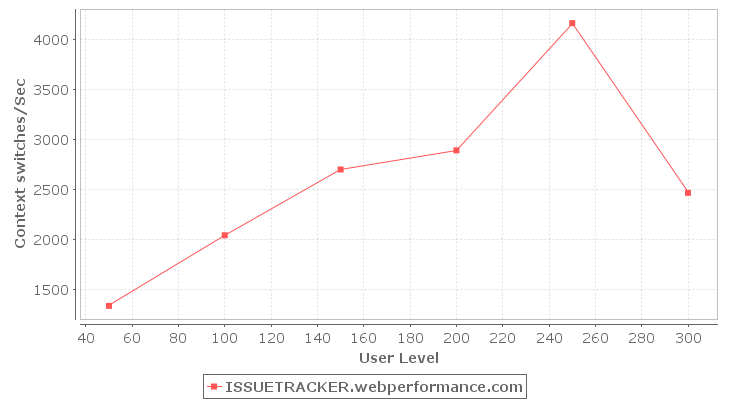
| User Level | ISSUETRACKER.webperformance.com |
| 50 | 1,332 |
| 100 | 2,040 |
| 150 | 2,700 |
| 200 | 2,891 |
| 250 | 4,168 |
| 300 | 2,465 |
Time-based Analysis
| Time | Users | ISSUETRACKER.webperformance.com |
| 00:00:10 | 10 | 1,053 |
| 00:00:20 | 22 | 1,547 |
| 00:00:30 | 32 | 796 |
| 00:00:40 | 39 | 949 |
| 00:00:50 | 43 | 1,245 |
| 00:01:00 | 49 | 1,460 |
| 00:01:10 | 50 | 1,358 |
| 00:01:20 | 50 | 1,217 |
| 00:01:30 | 50 | 1,649 |
| 00:01:40 | 50 | 1,209 |
| 00:01:50 | 50 | 1,219 |
| 00:02:00 | 50 | 1,342 |
| 00:02:10 | 55 | 1,348 |
| 00:02:20 | 63 | 1,453 |
| 00:02:30 | 70 | 1,574 |
| 00:02:40 | 80 | 1,674 |
| 00:02:50 | 92 | 1,850 |
| 00:03:00 | 95 | 1,971 |
| 00:03:10 | 100 | 1,992 |
| 00:03:20 | 100 | 2,142 |
| 00:03:30 | 100 | 1,908 |
| 00:03:40 | 100 | 2,028 |
| 00:03:50 | 100 | 2,140 |
| 00:04:00 | 100 | 2,035 |
| 00:04:10 | 101 | 1,985 |
| 00:04:20 | 114 | 2,285 |
| 00:04:30 | 125 | 2,288 |
| 00:04:40 | 133 | 2,369 |
| 00:04:50 | 137 | 2,662 |
| 00:05:00 | 144 | 2,833 |
| 00:05:10 | 150 | 2,640 |
| 00:05:20 | 150 | 2,657 |
| 00:05:30 | 150 | 2,894 |
| 00:05:40 | 150 | 2,869 |
| 00:05:50 | 150 | 2,632 |
| 00:06:00 | 150 | 2,699 |
| 00:06:10 | 150 | 2,513 |
| 00:06:20 | 158 | 2,806 |
| 00:06:30 | 167 | 3,094 |
| 00:06:40 | 176 | 3,075 |
| 00:06:50 | 181 | 3,160 |
| 00:07:00 | 190 | 2,872 |
| 00:07:10 | 200 | 2,128 |
| 00:07:20 | 200 | 2,855 |
| 00:07:30 | 200 | 3,233 |
| 00:07:40 | 200 | 2,783 |
| 00:07:50 | 200 | 2,825 |
| 00:08:00 | 200 | 3,620 |
| 00:08:10 | 200 | 2,796 |
| 00:08:20 | 209 | 3,145 |
| 00:08:30 | 220 | 3,158 |
| 00:08:40 | 228 | 3,451 |
| 00:08:50 | 235 | 2,746 |
| 00:09:00 | 242 | 2,842 |
| 00:09:10 | 250 | 3,051 |
| 00:09:20 | 250 | 2,593 |
| 00:09:30 | 250 | 2,726 |
| 00:09:40 | 250 | 4,453 |
| 00:09:50 | 250 | 6,367 |
| 00:10:00 | 250 | 6,622 |
| 00:10:10 | 250 | 3,366 |
| 00:10:20 | 254 | 2,361 |
| 00:10:30 | 266 | 2,606 |
| 00:10:40 | 269 | 3,158 |
| 00:10:50 | 277 | 2,568 |
| 00:11:00 | 289 | 2,477 |
| 00:11:10 | 300 | 2,229 |
| 00:11:20 | 300 | 2,356 |
| 00:11:30 | 300 | 2,537 |
| 00:11:40 | 300 | 2,487 |
| 00:11:50 | 300 | 2,751 |
| 00:12:00 | 300 | 2,432 |
| 00:12:10 | 233 | 2,538 |
| 00:12:20 | 158 | 3,986 |
| 00:12:30 | 66 | 3,065 |
| 00:12:40 | 5 | 1,423 |
| 00:12:50 | 0 |
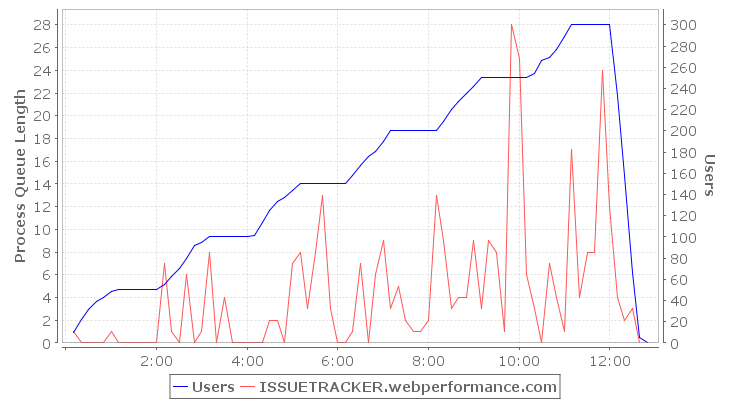
Process Queue Length
Number of system threads in process queue
User Level Analysis
Learn more about User Level Analysis by watching the User Level Analysis screencast
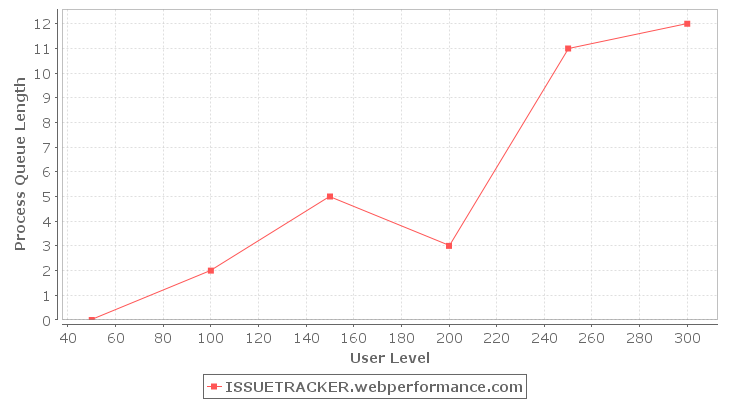
| User Level | ISSUETRACKER.webperformance.com |
| 50 | 0 |
| 100 | 2 |
| 150 | 5 |
| 200 | 3 |
| 250 | 11 |
| 300 | 12 |
Time-based Analysis
| Time | Users | ISSUETRACKER.webperformance.com |
| 00:00:10 | 10 | 1 |
| 00:00:20 | 22 | 0 |
| 00:00:30 | 32 | 0 |
| 00:00:40 | 39 | 0 |
| 00:00:50 | 43 | 0 |
| 00:01:00 | 49 | 1 |
| 00:01:10 | 50 | 0 |
| 00:01:20 | 50 | 0 |
| 00:01:30 | 50 | 0 |
| 00:01:40 | 50 | 0 |
| 00:01:50 | 50 | 0 |
| 00:02:00 | 50 | 0 |
| 00:02:10 | 55 | 7 |
| 00:02:20 | 63 | 1 |
| 00:02:30 | 70 | 0 |
| 00:02:40 | 80 | 6 |
| 00:02:50 | 92 | 0 |
| 00:03:00 | 95 | 1 |
| 00:03:10 | 100 | 8 |
| 00:03:20 | 100 | 0 |
| 00:03:30 | 100 | 4 |
| 00:03:40 | 100 | 0 |
| 00:03:50 | 100 | 0 |
| 00:04:00 | 100 | 0 |
| 00:04:10 | 101 | 0 |
| 00:04:20 | 114 | 0 |
| 00:04:30 | 125 | 2 |
| 00:04:40 | 133 | 2 |
| 00:04:50 | 137 | 0 |
| 00:05:00 | 144 | 7 |
| 00:05:10 | 150 | 8 |
| 00:05:20 | 150 | 3 |
| 00:05:30 | 150 | 8 |
| 00:05:40 | 150 | 13 |
| 00:05:50 | 150 | 3 |
| 00:06:00 | 150 | 0 |
| 00:06:10 | 150 | 0 |
| 00:06:20 | 158 | 1 |
| 00:06:30 | 167 | 7 |
| 00:06:40 | 176 | 0 |
| 00:06:50 | 181 | 6 |
| 00:07:00 | 190 | 9 |
| 00:07:10 | 200 | 3 |
| 00:07:20 | 200 | 5 |
| 00:07:30 | 200 | 2 |
| 00:07:40 | 200 | 1 |
| 00:07:50 | 200 | 1 |
| 00:08:00 | 200 | 2 |
| 00:08:10 | 200 | 13 |
| 00:08:20 | 209 | 9 |
| 00:08:30 | 220 | 3 |
| 00:08:40 | 228 | 4 |
| 00:08:50 | 235 | 4 |
| 00:09:00 | 242 | 9 |
| 00:09:10 | 250 | 3 |
| 00:09:20 | 250 | 9 |
| 00:09:30 | 250 | 8 |
| 00:09:40 | 250 | 1 |
| 00:09:50 | 250 | 28 |
| 00:10:00 | 250 | 25 |
| 00:10:10 | 250 | 6 |
| 00:10:20 | 254 | 3 |
| 00:10:30 | 266 | 0 |
| 00:10:40 | 269 | 7 |
| 00:10:50 | 277 | 4 |
| 00:11:00 | 289 | 1 |
| 00:11:10 | 300 | 17 |
| 00:11:20 | 300 | 4 |
| 00:11:30 | 300 | 8 |
| 00:11:40 | 300 | 8 |
| 00:11:50 | 300 | 24 |
| 00:12:00 | 300 | 12 |
| 00:12:10 | 233 | 4 |
| 00:12:20 | 158 | 2 |
| 00:12:30 | 66 | 3 |
| 00:12:40 | 5 | 0 |
| 00:12:50 | 0 |
Page reads/sec
Rate of major memory faults resulting in page reads
User Level Analysis
Learn more about User Level Analysis by watching the User Level Analysis screencast
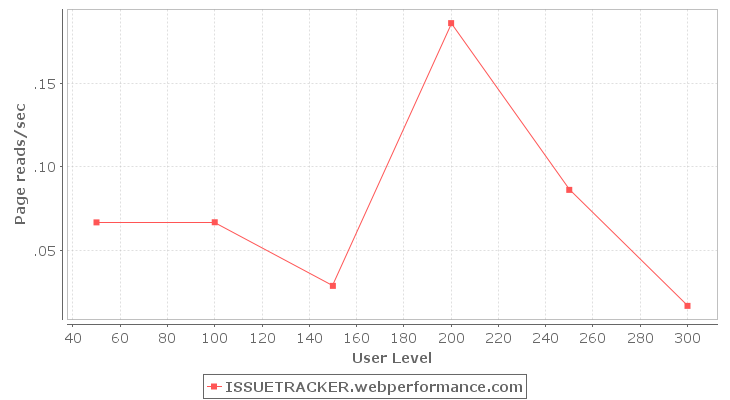
| User Level | ISSUETRACKER.webperformance.com |
| 50 | .07 |
| 100 | .07 |
| 150 | .03 |
| 200 | .19 |
| 250 | .09 |
| 300 | .02 |
Time-based Analysis
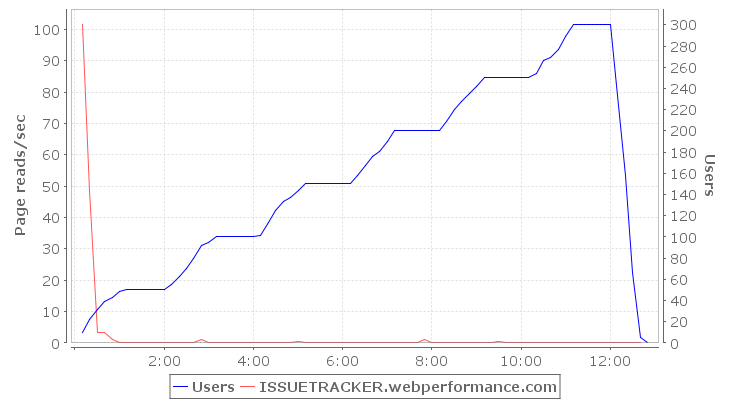
| Time | Users | ISSUETRACKER.webperformance.com |
| 00:00:10 | 10 | 101.41 |
| 00:00:20 | 22 | 48.58 |
| 00:00:30 | 32 | 3.30 |
| 00:00:40 | 39 | 3.41 |
| 00:00:50 | 43 | 1.00 |
| 00:01:00 | 49 | .00 |
| 00:01:10 | 50 | .20 |
| 00:01:20 | 50 | .00 |
| 00:01:30 | 50 | .20 |
| 00:01:40 | 50 | .00 |
| 00:01:50 | 50 | .00 |
| 00:02:00 | 50 | .00 |
| 00:02:10 | 55 | .10 |
| 00:02:20 | 63 | .10 |
| 00:02:30 | 70 | .00 |
| 00:02:40 | 80 | .00 |
| 00:02:50 | 92 | 1.10 |
| 00:03:00 | 95 | .00 |
| 00:03:10 | 100 | .30 |
| 00:03:20 | 100 | .00 |
| 00:03:30 | 100 | .00 |
| 00:03:40 | 100 | .10 |
| 00:03:50 | 100 | .00 |
| 00:04:00 | 100 | .00 |
| 00:04:10 | 101 | .20 |
| 00:04:20 | 114 | .00 |
| 00:04:30 | 125 | .00 |
| 00:04:40 | 133 | .00 |
| 00:04:50 | 137 | .00 |
| 00:05:00 | 144 | .60 |
| 00:05:10 | 150 | .20 |
| 00:05:20 | 150 | .00 |
| 00:05:30 | 150 | .00 |
| 00:05:40 | 150 | .00 |
| 00:05:50 | 150 | .00 |
| 00:06:00 | 150 | .00 |
| 00:06:10 | 150 | .00 |
| 00:06:20 | 158 | .00 |
| 00:06:30 | 167 | .00 |
| 00:06:40 | 176 | .00 |
| 00:06:50 | 181 | .00 |
| 00:07:00 | 190 | .00 |
| 00:07:10 | 200 | .30 |
| 00:07:20 | 200 | .00 |
| 00:07:30 | 200 | .00 |
| 00:07:40 | 200 | .00 |
| 00:07:50 | 200 | 1.00 |
| 00:08:00 | 200 | .00 |
| 00:08:10 | 200 | .00 |
| 00:08:20 | 209 | .00 |
| 00:08:30 | 220 | .10 |
| 00:08:40 | 228 | .10 |
| 00:08:50 | 235 | .00 |
| 00:09:00 | 242 | .00 |
| 00:09:10 | 250 | .00 |
| 00:09:20 | 250 | .00 |
| 00:09:30 | 250 | .60 |
| 00:09:40 | 250 | .00 |
| 00:09:50 | 250 | .00 |
| 00:10:00 | 250 | .00 |
| 00:10:10 | 250 | .00 |
| 00:10:20 | 254 | .00 |
| 00:10:30 | 266 | .00 |
| 00:10:40 | 269 | .00 |
| 00:10:50 | 277 | .00 |
| 00:11:00 | 289 | .00 |
| 00:11:10 | 300 | .00 |
| 00:11:20 | 300 | .00 |
| 00:11:30 | 300 | .00 |
| 00:11:40 | 300 | .00 |
| 00:11:50 | 300 | .10 |
| 00:12:00 | 300 | .00 |
| 00:12:10 | 233 | .00 |
| 00:12:20 | 158 | .10 |
| 00:12:30 | 66 | .00 |
| 00:12:40 | 5 | .00 |
| 00:12:50 | 0 |
Page writes/sec
Rate at which pages are moved to disk to free space in physical memory
User Level Analysis
Learn more about User Level Analysis by watching the User Level Analysis screencast
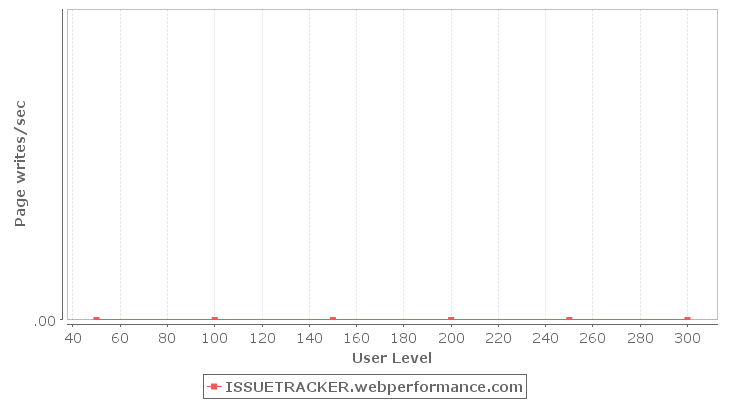
| User Level | ISSUETRACKER.webperformance.com |
| 50 | .00 |
| 100 | .00 |
| 150 | .00 |
| 200 | .00 |
| 250 | .00 |
| 300 | .00 |
Time-based Analysis
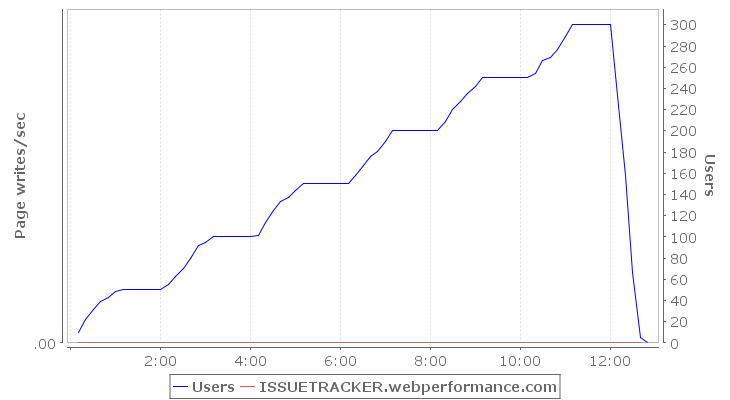
| Time | Users | ISSUETRACKER.webperformance.com |
| 00:00:10 | 10 | .00 |
| 00:00:20 | 22 | .00 |
| 00:00:30 | 32 | .00 |
| 00:00:40 | 39 | .00 |
| 00:00:50 | 43 | .00 |
| 00:01:00 | 49 | .00 |
| 00:01:10 | 50 | .00 |
| 00:01:20 | 50 | .00 |
| 00:01:30 | 50 | .00 |
| 00:01:40 | 50 | .00 |
| 00:01:50 | 50 | .00 |
| 00:02:00 | 50 | .00 |
| 00:02:10 | 55 | .00 |
| 00:02:20 | 63 | .00 |
| 00:02:30 | 70 | .00 |
| 00:02:40 | 80 | .00 |
| 00:02:50 | 92 | .00 |
| 00:03:00 | 95 | .00 |
| 00:03:10 | 100 | .00 |
| 00:03:20 | 100 | .00 |
| 00:03:30 | 100 | .00 |
| 00:03:40 | 100 | .00 |
| 00:03:50 | 100 | .00 |
| 00:04:00 | 100 | .00 |
| 00:04:10 | 101 | .00 |
| 00:04:20 | 114 | .00 |
| 00:04:30 | 125 | .00 |
| 00:04:40 | 133 | .00 |
| 00:04:50 | 137 | .00 |
| 00:05:00 | 144 | .00 |
| 00:05:10 | 150 | .00 |
| 00:05:20 | 150 | .00 |
| 00:05:30 | 150 | .00 |
| 00:05:40 | 150 | .00 |
| 00:05:50 | 150 | .00 |
| 00:06:00 | 150 | .00 |
| 00:06:10 | 150 | .00 |
| 00:06:20 | 158 | .00 |
| 00:06:30 | 167 | .00 |
| 00:06:40 | 176 | .00 |
| 00:06:50 | 181 | .00 |
| 00:07:00 | 190 | .00 |
| 00:07:10 | 200 | .00 |
| 00:07:20 | 200 | .00 |
| 00:07:30 | 200 | .00 |
| 00:07:40 | 200 | .00 |
| 00:07:50 | 200 | .00 |
| 00:08:00 | 200 | .00 |
| 00:08:10 | 200 | .00 |
| 00:08:20 | 209 | .00 |
| 00:08:30 | 220 | .00 |
| 00:08:40 | 228 | .00 |
| 00:08:50 | 235 | .00 |
| 00:09:00 | 242 | .00 |
| 00:09:10 | 250 | .00 |
| 00:09:20 | 250 | .00 |
| 00:09:30 | 250 | .00 |
| 00:09:40 | 250 | .00 |
| 00:09:50 | 250 | .00 |
| 00:10:00 | 250 | .00 |
| 00:10:10 | 250 | .00 |
| 00:10:20 | 254 | .00 |
| 00:10:30 | 266 | .00 |
| 00:10:40 | 269 | .00 |
| 00:10:50 | 277 | .00 |
| 00:11:00 | 289 | .00 |
| 00:11:10 | 300 | .00 |
| 00:11:20 | 300 | .00 |
| 00:11:30 | 300 | .00 |
| 00:11:40 | 300 | .00 |
| 00:11:50 | 300 | .00 |
| 00:12:00 | 300 | .00 |
| 00:12:10 | 233 | .00 |
| 00:12:20 | 158 | .00 |
| 00:12:30 | 66 | .00 |
| 00:12:40 | 5 | .00 |
| 00:12:50 | 0 |
Disk I/O Time %
Elapsed time during which a disk was servicing read or write requests
User Level Analysis
Learn more about User Level Analysis by watching the User Level Analysis screencast
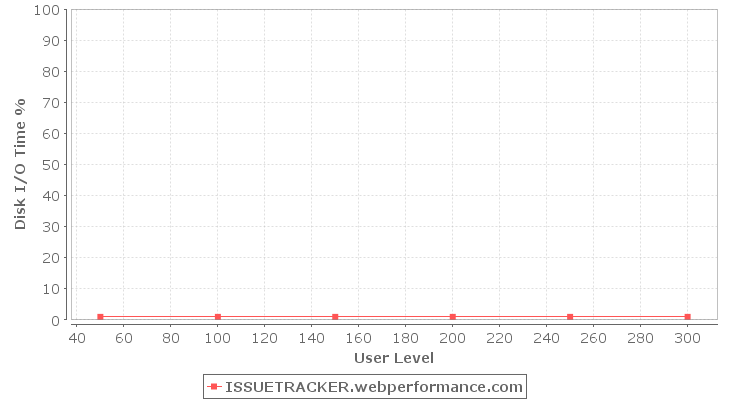
| User Level | ISSUETRACKER.webperformance.com |
| 50 | 1% |
| 100 | 1% |
| 150 | 1% |
| 200 | 1% |
| 250 | 1% |
| 300 | 1% |
Time-based Analysis
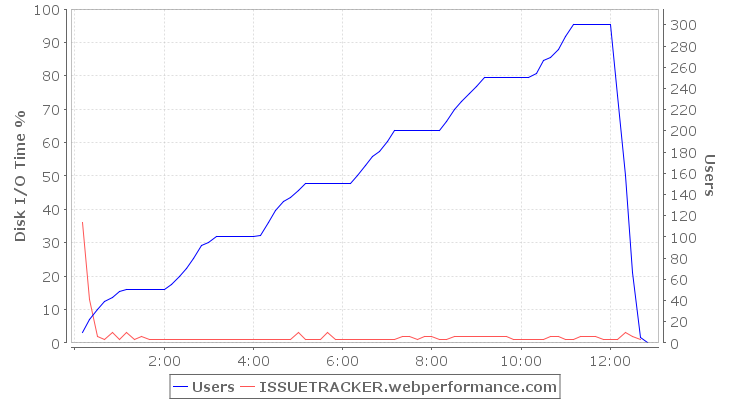
| Time | Users | ISSUETRACKER.webperformance.com |
| 00:00:10 | 10 | 36% |
| 00:00:20 | 22 | 13% |
| 00:00:30 | 32 | 2% |
| 00:00:40 | 39 | 1% |
| 00:00:50 | 43 | 3% |
| 00:01:00 | 49 | 1% |
| 00:01:10 | 50 | 3% |
| 00:01:20 | 50 | 1% |
| 00:01:30 | 50 | 2% |
| 00:01:40 | 50 | 1% |
| 00:01:50 | 50 | 1% |
| 00:02:00 | 50 | 1% |
| 00:02:10 | 55 | 1% |
| 00:02:20 | 63 | 1% |
| 00:02:30 | 70 | 1% |
| 00:02:40 | 80 | 1% |
| 00:02:50 | 92 | 1% |
| 00:03:00 | 95 | 1% |
| 00:03:10 | 100 | 1% |
| 00:03:20 | 100 | 1% |
| 00:03:30 | 100 | 1% |
| 00:03:40 | 100 | 1% |
| 00:03:50 | 100 | 1% |
| 00:04:00 | 100 | 1% |
| 00:04:10 | 101 | 1% |
| 00:04:20 | 114 | 1% |
| 00:04:30 | 125 | 1% |
| 00:04:40 | 133 | 1% |
| 00:04:50 | 137 | 1% |
| 00:05:00 | 144 | 3% |
| 00:05:10 | 150 | 1% |
| 00:05:20 | 150 | 1% |
| 00:05:30 | 150 | 1% |
| 00:05:40 | 150 | 3% |
| 00:05:50 | 150 | 1% |
| 00:06:00 | 150 | 1% |
| 00:06:10 | 150 | 1% |
| 00:06:20 | 158 | 1% |
| 00:06:30 | 167 | 1% |
| 00:06:40 | 176 | 1% |
| 00:06:50 | 181 | 1% |
| 00:07:00 | 190 | 1% |
| 00:07:10 | 200 | 1% |
| 00:07:20 | 200 | 2% |
| 00:07:30 | 200 | 2% |
| 00:07:40 | 200 | 1% |
| 00:07:50 | 200 | 2% |
| 00:08:00 | 200 | 2% |
| 00:08:10 | 200 | 1% |
| 00:08:20 | 209 | 1% |
| 00:08:30 | 220 | 2% |
| 00:08:40 | 228 | 2% |
| 00:08:50 | 235 | 2% |
| 00:09:00 | 242 | 2% |
| 00:09:10 | 250 | 2% |
| 00:09:20 | 250 | 2% |
| 00:09:30 | 250 | 2% |
| 00:09:40 | 250 | 2% |
| 00:09:50 | 250 | 1% |
| 00:10:00 | 250 | 1% |
| 00:10:10 | 250 | 1% |
| 00:10:20 | 254 | 1% |
| 00:10:30 | 266 | 1% |
| 00:10:40 | 269 | 2% |
| 00:10:50 | 277 | 2% |
| 00:11:00 | 289 | 1% |
| 00:11:10 | 300 | 1% |
| 00:11:20 | 300 | 2% |
| 00:11:30 | 300 | 2% |
| 00:11:40 | 300 | 2% |
| 00:11:50 | 300 | 1% |
| 00:12:00 | 300 | 1% |
| 00:12:10 | 233 | 1% |
| 00:12:20 | 158 | 3% |
| 00:12:30 | 66 | 2% |
| 00:12:40 | 5 | 1% |
| 00:12:50 | 0 |
Avg Disk Service Time (ms)
Average amount of time for each disk I/O transfer (ms)
User Level Analysis
Learn more about User Level Analysis by watching the User Level Analysis screencast
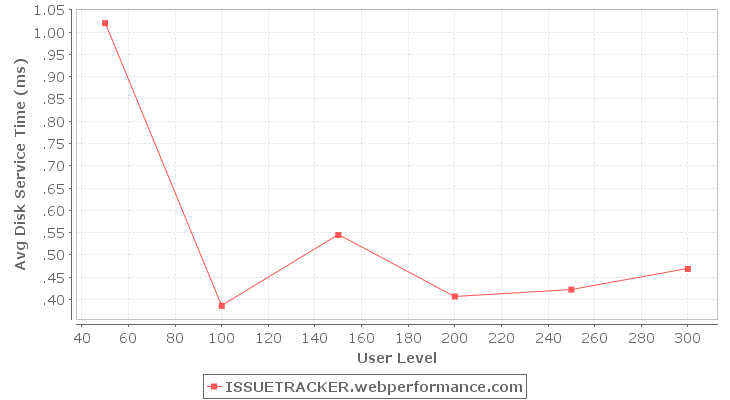
| User Level | ISSUETRACKER.webperformance.com |
| 50 | 1.02 |
| 100 | .39 |
| 150 | .54 |
| 200 | .41 |
| 250 | .42 |
| 300 | .47 |
Time-based Analysis
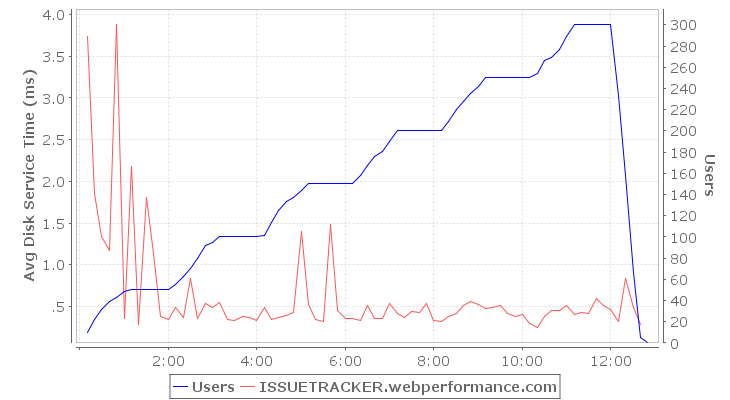
| Time | Users | ISSUETRACKER.webperformance.com |
| 00:00:10 | 10 | 3.74 |
| 00:00:20 | 22 | 1.85 |
| 00:00:30 | 32 | 1.34 |
| 00:00:40 | 39 | 1.17 |
| 00:00:50 | 43 | 3.89 |
| 00:01:00 | 49 | .35 |
| 00:01:10 | 50 | 2.18 |
| 00:01:20 | 50 | .28 |
| 00:01:30 | 50 | 1.81 |
| 00:01:40 | 50 | 1.13 |
| 00:01:50 | 50 | .38 |
| 00:02:00 | 50 | .34 |
| 00:02:10 | 55 | .48 |
| 00:02:20 | 63 | .37 |
| 00:02:30 | 70 | .84 |
| 00:02:40 | 80 | .36 |
| 00:02:50 | 92 | .54 |
| 00:03:00 | 95 | .49 |
| 00:03:10 | 100 | .55 |
| 00:03:20 | 100 | .34 |
| 00:03:30 | 100 | .33 |
| 00:03:40 | 100 | .38 |
| 00:03:50 | 100 | .37 |
| 00:04:00 | 100 | .33 |
| 00:04:10 | 101 | .49 |
| 00:04:20 | 114 | .34 |
| 00:04:30 | 125 | .37 |
| 00:04:40 | 133 | .39 |
| 00:04:50 | 137 | .43 |
| 00:05:00 | 144 | 1.40 |
| 00:05:10 | 150 | .52 |
| 00:05:20 | 150 | .34 |
| 00:05:30 | 150 | .32 |
| 00:05:40 | 150 | 1.48 |
| 00:05:50 | 150 | .45 |
| 00:06:00 | 150 | .36 |
| 00:06:10 | 150 | .35 |
| 00:06:20 | 158 | .34 |
| 00:06:30 | 167 | .52 |
| 00:06:40 | 176 | .36 |
| 00:06:50 | 181 | .36 |
| 00:07:00 | 190 | .53 |
| 00:07:10 | 200 | .41 |
| 00:07:20 | 200 | .37 |
| 00:07:30 | 200 | .44 |
| 00:07:40 | 200 | .42 |
| 00:07:50 | 200 | .54 |
| 00:08:00 | 200 | .34 |
| 00:08:10 | 200 | .32 |
| 00:08:20 | 209 | .38 |
| 00:08:30 | 220 | .42 |
| 00:08:40 | 228 | .51 |
| 00:08:50 | 235 | .56 |
| 00:09:00 | 242 | .52 |
| 00:09:10 | 250 | .48 |
| 00:09:20 | 250 | .48 |
| 00:09:30 | 250 | .51 |
| 00:09:40 | 250 | .41 |
| 00:09:50 | 250 | .37 |
| 00:10:00 | 250 | .40 |
| 00:10:10 | 250 | .29 |
| 00:10:20 | 254 | .24 |
| 00:10:30 | 266 | .38 |
| 00:10:40 | 269 | .45 |
| 00:10:50 | 277 | .45 |
| 00:11:00 | 289 | .51 |
| 00:11:10 | 300 | .40 |
| 00:11:20 | 300 | .42 |
| 00:11:30 | 300 | .42 |
| 00:11:40 | 300 | .59 |
| 00:11:50 | 300 | .52 |
| 00:12:00 | 300 | .47 |
| 00:12:10 | 233 | .32 |
| 00:12:20 | 158 | .83 |
| 00:12:30 | 66 | .48 |
| 00:12:40 | 5 | .28 |
| 00:12:50 | 0 |
Disk Queue Length
Queued Disk Operations
User Level Analysis
Learn more about User Level Analysis by watching the User Level Analysis screencast
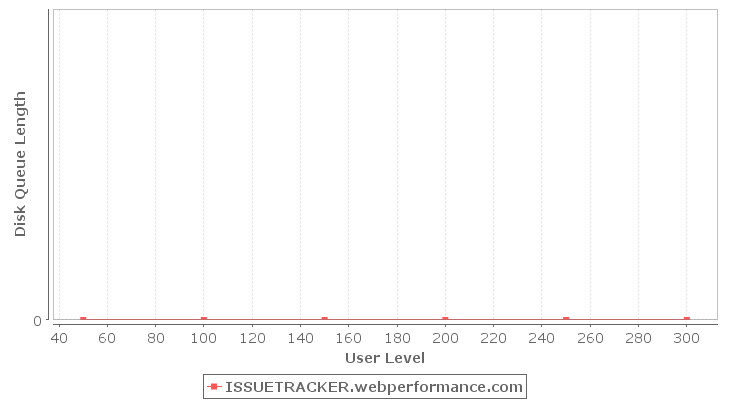
| User Level | ISSUETRACKER.webperformance.com |
| 50 | 0 |
| 100 | 0 |
| 150 | 0 |
| 200 | 0 |
| 250 | 0 |
| 300 | 0 |
Time-based Analysis
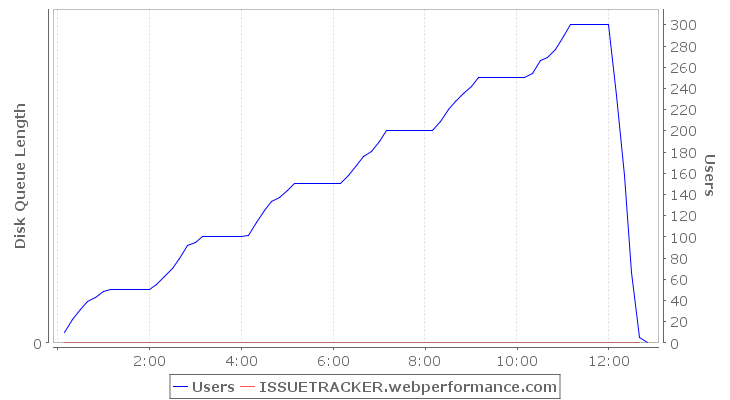
| Time | Users | ISSUETRACKER.webperformance.com |
| 00:00:10 | 10 | 0 |
| 00:00:20 | 22 | 0 |
| 00:00:30 | 32 | 0 |
| 00:00:40 | 39 | 0 |
| 00:00:50 | 43 | 0 |
| 00:01:00 | 49 | 0 |
| 00:01:10 | 50 | 0 |
| 00:01:20 | 50 | 0 |
| 00:01:30 | 50 | 0 |
| 00:01:40 | 50 | 0 |
| 00:01:50 | 50 | 0 |
| 00:02:00 | 50 | 0 |
| 00:02:10 | 55 | 0 |
| 00:02:20 | 63 | 0 |
| 00:02:30 | 70 | 0 |
| 00:02:40 | 80 | 0 |
| 00:02:50 | 92 | 0 |
| 00:03:00 | 95 | 0 |
| 00:03:10 | 100 | 0 |
| 00:03:20 | 100 | 0 |
| 00:03:30 | 100 | 0 |
| 00:03:40 | 100 | 0 |
| 00:03:50 | 100 | 0 |
| 00:04:00 | 100 | 0 |
| 00:04:10 | 101 | 0 |
| 00:04:20 | 114 | 0 |
| 00:04:30 | 125 | 0 |
| 00:04:40 | 133 | 0 |
| 00:04:50 | 137 | 0 |
| 00:05:00 | 144 | 0 |
| 00:05:10 | 150 | 0 |
| 00:05:20 | 150 | 0 |
| 00:05:30 | 150 | 0 |
| 00:05:40 | 150 | 0 |
| 00:05:50 | 150 | 0 |
| 00:06:00 | 150 | 0 |
| 00:06:10 | 150 | 0 |
| 00:06:20 | 158 | 0 |
| 00:06:30 | 167 | 0 |
| 00:06:40 | 176 | 0 |
| 00:06:50 | 181 | 0 |
| 00:07:00 | 190 | 0 |
| 00:07:10 | 200 | 0 |
| 00:07:20 | 200 | 0 |
| 00:07:30 | 200 | 0 |
| 00:07:40 | 200 | 0 |
| 00:07:50 | 200 | 0 |
| 00:08:00 | 200 | 0 |
| 00:08:10 | 200 | 0 |
| 00:08:20 | 209 | 0 |
| 00:08:30 | 220 | 0 |
| 00:08:40 | 228 | 0 |
| 00:08:50 | 235 | 0 |
| 00:09:00 | 242 | 0 |
| 00:09:10 | 250 | 0 |
| 00:09:20 | 250 | 0 |
| 00:09:30 | 250 | 0 |
| 00:09:40 | 250 | 0 |
| 00:09:50 | 250 | 0 |
| 00:10:00 | 250 | 0 |
| 00:10:10 | 250 | 0 |
| 00:10:20 | 254 | 0 |
| 00:10:30 | 266 | 0 |
| 00:10:40 | 269 | 0 |
| 00:10:50 | 277 | 0 |
| 00:11:00 | 289 | 0 |
| 00:11:10 | 300 | 0 |
| 00:11:20 | 300 | 0 |
| 00:11:30 | 300 | 0 |
| 00:11:40 | 300 | 0 |
| 00:11:50 | 300 | 0 |
| 00:12:00 | 300 | 0 |
| 00:12:10 | 233 | 0 |
| 00:12:20 | 158 | 0 |
| 00:12:30 | 66 | 0 |
| 00:12:40 | 5 | 0 |
| 00:12:50 | 0 |
Disk Reads/sec
Rate of disk read operations
User Level Analysis
Learn more about User Level Analysis by watching the User Level Analysis screencast
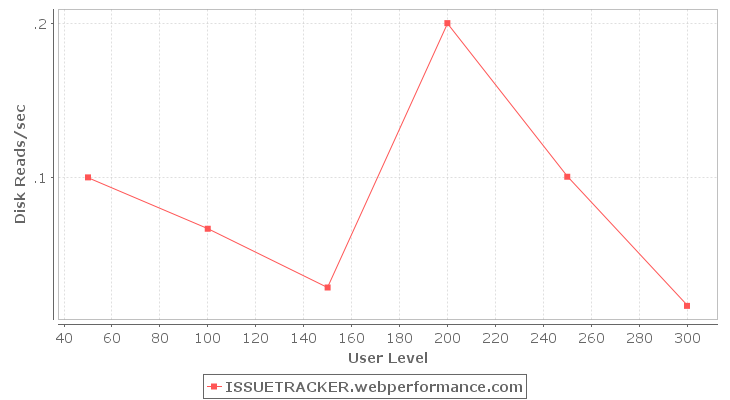
| User Level | ISSUETRACKER.webperformance.com |
| 50 | .1 |
| 100 | .1 |
| 150 | .0 |
| 200 | .2 |
| 250 | .1 |
| 300 | .0 |
Time-based Analysis
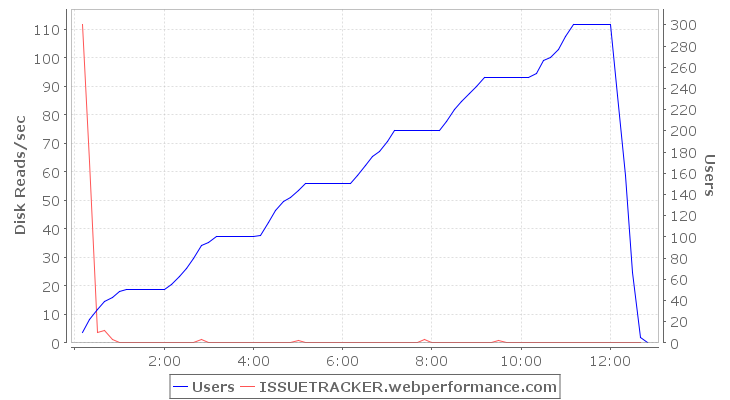
| Time | Users | ISSUETRACKER.webperformance.com |
| 00:00:10 | 10 | 111.6 |
| 00:00:20 | 22 | 63.8 |
| 00:00:30 | 32 | 3.8 |
| 00:00:40 | 39 | 4.2 |
| 00:00:50 | 43 | 1.2 |
| 00:01:00 | 49 | .0 |
| 00:01:10 | 50 | .3 |
| 00:01:20 | 50 | .1 |
| 00:01:30 | 50 | .2 |
| 00:01:40 | 50 | .0 |
| 00:01:50 | 50 | .0 |
| 00:02:00 | 50 | .0 |
| 00:02:10 | 55 | .2 |
| 00:02:20 | 63 | .1 |
| 00:02:30 | 70 | .0 |
| 00:02:40 | 80 | .0 |
| 00:02:50 | 92 | 1.1 |
| 00:03:00 | 95 | .0 |
| 00:03:10 | 100 | .3 |
| 00:03:20 | 100 | .0 |
| 00:03:30 | 100 | .0 |
| 00:03:40 | 100 | .1 |
| 00:03:50 | 100 | .0 |
| 00:04:00 | 100 | .0 |
| 00:04:10 | 101 | .3 |
| 00:04:20 | 114 | .0 |
| 00:04:30 | 125 | .0 |
| 00:04:40 | 133 | .0 |
| 00:04:50 | 137 | .0 |
| 00:05:00 | 144 | .7 |
| 00:05:10 | 150 | .2 |
| 00:05:20 | 150 | .0 |
| 00:05:30 | 150 | .0 |
| 00:05:40 | 150 | .0 |
| 00:05:50 | 150 | .0 |
| 00:06:00 | 150 | .0 |
| 00:06:10 | 150 | .0 |
| 00:06:20 | 158 | .0 |
| 00:06:30 | 167 | .0 |
| 00:06:40 | 176 | .0 |
| 00:06:50 | 181 | .0 |
| 00:07:00 | 190 | .0 |
| 00:07:10 | 200 | .3 |
| 00:07:20 | 200 | .0 |
| 00:07:30 | 200 | .0 |
| 00:07:40 | 200 | .0 |
| 00:07:50 | 200 | 1.1 |
| 00:08:00 | 200 | .0 |
| 00:08:10 | 200 | .0 |
| 00:08:20 | 209 | .0 |
| 00:08:30 | 220 | .1 |
| 00:08:40 | 228 | .1 |
| 00:08:50 | 235 | .0 |
| 00:09:00 | 242 | .0 |
| 00:09:10 | 250 | .0 |
| 00:09:20 | 250 | .0 |
| 00:09:30 | 250 | .7 |
| 00:09:40 | 250 | .0 |
| 00:09:50 | 250 | .0 |
| 00:10:00 | 250 | .0 |
| 00:10:10 | 250 | .0 |
| 00:10:20 | 254 | .0 |
| 00:10:30 | 266 | .0 |
| 00:10:40 | 269 | .0 |
| 00:10:50 | 277 | .0 |
| 00:11:00 | 289 | .0 |
| 00:11:10 | 300 | .0 |
| 00:11:20 | 300 | .0 |
| 00:11:30 | 300 | .0 |
| 00:11:40 | 300 | .0 |
| 00:11:50 | 300 | .1 |
| 00:12:00 | 300 | .0 |
| 00:12:10 | 233 | .0 |
| 00:12:20 | 158 | .1 |
| 00:12:30 | 66 | .0 |
| 00:12:40 | 5 | .0 |
| 00:12:50 | 0 |
Disk Writes/sec
Rate of disk write operations
User Level Analysis
Learn more about User Level Analysis by watching the User Level Analysis screencast
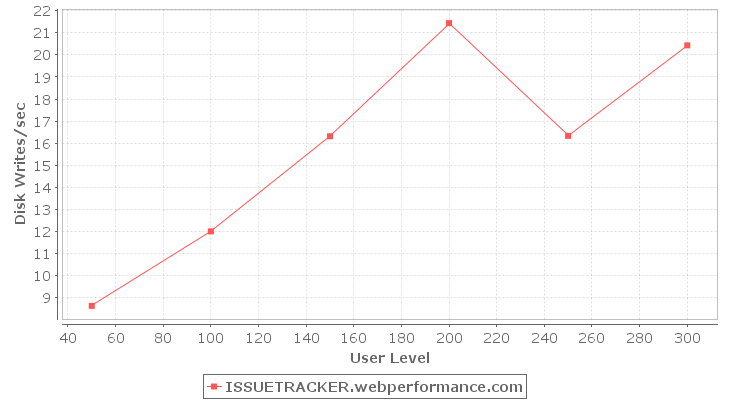
| User Level | ISSUETRACKER.webperformance.com |
| 50 | 8.6 |
| 100 | 12.0 |
| 150 | 16.3 |
| 200 | 21.4 |
| 250 | 16.3 |
| 300 | 20.4 |
Time-based Analysis
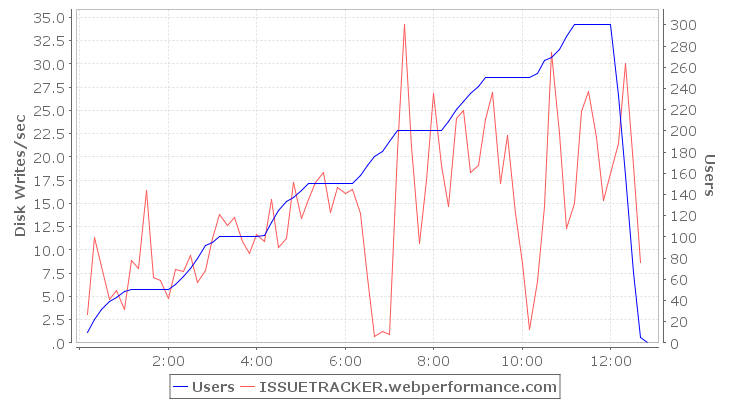
| Time | Users | ISSUETRACKER.webperformance.com |
| 00:00:10 | 10 | 3.0 |
| 00:00:20 | 22 | 11.3 |
| 00:00:30 | 32 | 8.2 |
| 00:00:40 | 39 | 4.7 |
| 00:00:50 | 43 | 5.6 |
| 00:01:00 | 49 | 3.6 |
| 00:01:10 | 50 | 8.9 |
| 00:01:20 | 50 | 8.0 |
| 00:01:30 | 50 | 16.4 |
| 00:01:40 | 50 | 7.0 |
| 00:01:50 | 50 | 6.7 |
| 00:02:00 | 50 | 4.8 |
| 00:02:10 | 55 | 7.9 |
| 00:02:20 | 63 | 7.7 |
| 00:02:30 | 70 | 9.4 |
| 00:02:40 | 80 | 6.5 |
| 00:02:50 | 92 | 7.8 |
| 00:03:00 | 95 | 11.2 |
| 00:03:10 | 100 | 13.8 |
| 00:03:20 | 100 | 12.6 |
| 00:03:30 | 100 | 13.5 |
| 00:03:40 | 100 | 10.9 |
| 00:03:50 | 100 | 9.6 |
| 00:04:00 | 100 | 11.6 |
| 00:04:10 | 101 | 10.9 |
| 00:04:20 | 114 | 15.4 |
| 00:04:30 | 125 | 10.3 |
| 00:04:40 | 133 | 11.2 |
| 00:04:50 | 137 | 17.2 |
| 00:05:00 | 144 | 13.4 |
| 00:05:10 | 150 | 15.4 |
| 00:05:20 | 150 | 17.2 |
| 00:05:30 | 150 | 18.3 |
| 00:05:40 | 150 | 14.0 |
| 00:05:50 | 150 | 16.7 |
| 00:06:00 | 150 | 16.0 |
| 00:06:10 | 150 | 16.5 |
| 00:06:20 | 158 | 13.9 |
| 00:06:30 | 167 | 7.0 |
| 00:06:40 | 176 | .7 |
| 00:06:50 | 181 | 1.2 |
| 00:07:00 | 190 | .9 |
| 00:07:10 | 200 | 20.6 |
| 00:07:20 | 200 | 34.2 |
| 00:07:30 | 200 | 21.1 |
| 00:07:40 | 200 | 10.7 |
| 00:07:50 | 200 | 17.4 |
| 00:08:00 | 200 | 26.8 |
| 00:08:10 | 200 | 19.1 |
| 00:08:20 | 209 | 14.7 |
| 00:08:30 | 220 | 24.2 |
| 00:08:40 | 228 | 25.0 |
| 00:08:50 | 235 | 18.4 |
| 00:09:00 | 242 | 19.1 |
| 00:09:10 | 250 | 24.0 |
| 00:09:20 | 250 | 26.9 |
| 00:09:30 | 250 | 17.2 |
| 00:09:40 | 250 | 22.3 |
| 00:09:50 | 250 | 13.9 |
| 00:10:00 | 250 | 8.5 |
| 00:10:10 | 250 | 1.5 |
| 00:10:20 | 254 | 6.6 |
| 00:10:30 | 266 | 14.7 |
| 00:10:40 | 269 | 31.2 |
| 00:10:50 | 277 | 22.5 |
| 00:11:00 | 289 | 12.3 |
| 00:11:10 | 300 | 14.9 |
| 00:11:20 | 300 | 24.9 |
| 00:11:30 | 300 | 27.1 |
| 00:11:40 | 300 | 22.1 |
| 00:11:50 | 300 | 15.3 |
| 00:12:00 | 300 | 18.2 |
| 00:12:10 | 233 | 21.5 |
| 00:12:20 | 158 | 30.0 |
| 00:12:30 | 66 | 19.0 |
| 00:12:40 | 5 | 8.7 |
| 00:12:50 | 0 |
Network Packets received/sec
Number of network packets received per second
User Level Analysis
Learn more about User Level Analysis by watching the User Level Analysis screencast
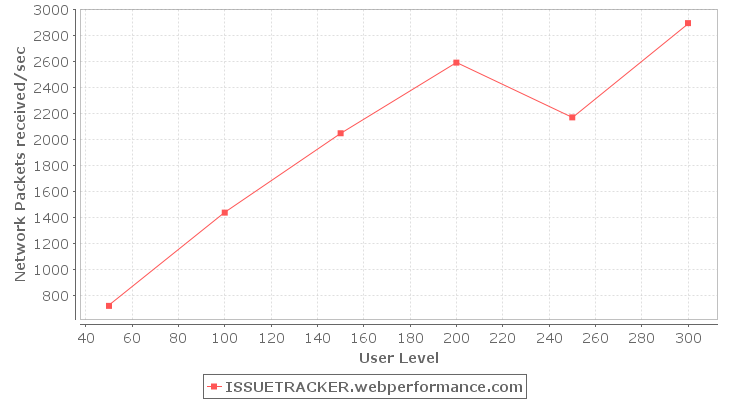
| User Level | ISSUETRACKER.webperformance.com |
| 50 | 719 |
| 100 | 1,437 |
| 150 | 2,048 |
| 200 | 2,592 |
| 250 | 2,170 |
| 300 | 2,896 |
Time-based Analysis
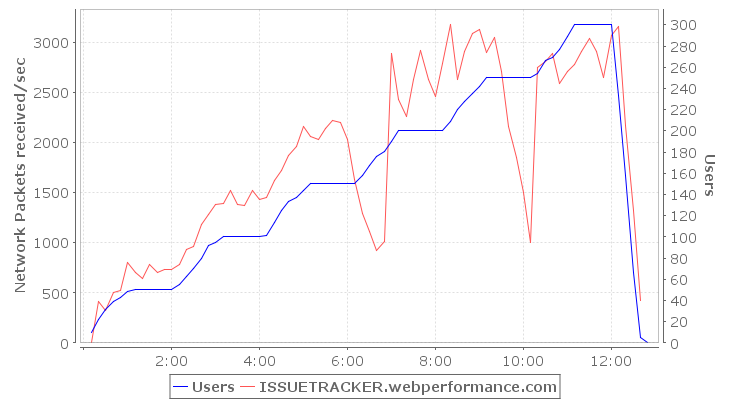
| Time | Users | ISSUETRACKER.webperformance.com |
| 00:00:10 | 10 | 8 |
| 00:00:20 | 22 | 411 |
| 00:00:30 | 32 | 325 |
| 00:00:40 | 39 | 506 |
| 00:00:50 | 43 | 527 |
| 00:01:00 | 49 | 808 |
| 00:01:10 | 50 | 707 |
| 00:01:20 | 50 | 649 |
| 00:01:30 | 50 | 787 |
| 00:01:40 | 50 | 701 |
| 00:01:50 | 50 | 735 |
| 00:02:00 | 50 | 735 |
| 00:02:10 | 55 | 789 |
| 00:02:20 | 63 | 932 |
| 00:02:30 | 70 | 966 |
| 00:02:40 | 80 | 1,188 |
| 00:02:50 | 92 | 1,282 |
| 00:03:00 | 95 | 1,387 |
| 00:03:10 | 100 | 1,393 |
| 00:03:20 | 100 | 1,522 |
| 00:03:30 | 100 | 1,379 |
| 00:03:40 | 100 | 1,369 |
| 00:03:50 | 100 | 1,527 |
| 00:04:00 | 100 | 1,436 |
| 00:04:10 | 101 | 1,456 |
| 00:04:20 | 114 | 1,622 |
| 00:04:30 | 125 | 1,719 |
| 00:04:40 | 133 | 1,873 |
| 00:04:50 | 137 | 1,959 |
| 00:05:00 | 144 | 2,160 |
| 00:05:10 | 150 | 2,067 |
| 00:05:20 | 150 | 2,037 |
| 00:05:30 | 150 | 2,148 |
| 00:05:40 | 150 | 2,219 |
| 00:05:50 | 150 | 2,205 |
| 00:06:00 | 150 | 2,032 |
| 00:06:10 | 150 | 1,631 |
| 00:06:20 | 158 | 1,292 |
| 00:06:30 | 167 | 1,110 |
| 00:06:40 | 176 | 928 |
| 00:06:50 | 181 | 1,012 |
| 00:07:00 | 190 | 2,889 |
| 00:07:10 | 200 | 2,437 |
| 00:07:20 | 200 | 2,260 |
| 00:07:30 | 200 | 2,632 |
| 00:07:40 | 200 | 2,923 |
| 00:07:50 | 200 | 2,632 |
| 00:08:00 | 200 | 2,468 |
| 00:08:10 | 200 | 2,794 |
| 00:08:20 | 209 | 3,179 |
| 00:08:30 | 220 | 2,637 |
| 00:08:40 | 228 | 2,911 |
| 00:08:50 | 235 | 3,095 |
| 00:09:00 | 242 | 3,134 |
| 00:09:10 | 250 | 2,899 |
| 00:09:20 | 250 | 3,050 |
| 00:09:30 | 250 | 2,715 |
| 00:09:40 | 250 | 2,166 |
| 00:09:50 | 250 | 1,853 |
| 00:10:00 | 250 | 1,508 |
| 00:10:10 | 250 | 1,002 |
| 00:10:20 | 254 | 2,753 |
| 00:10:30 | 266 | 2,816 |
| 00:10:40 | 269 | 2,888 |
| 00:10:50 | 277 | 2,589 |
| 00:11:00 | 289 | 2,711 |
| 00:11:10 | 300 | 2,779 |
| 00:11:20 | 300 | 2,914 |
| 00:11:30 | 300 | 3,047 |
| 00:11:40 | 300 | 2,912 |
| 00:11:50 | 300 | 2,652 |
| 00:12:00 | 300 | 3,073 |
| 00:12:10 | 233 | 3,167 |
| 00:12:20 | 158 | 2,169 |
| 00:12:30 | 66 | 1,320 |
| 00:12:40 | 5 | 429 |
| 00:12:50 | 0 |
Network Packets sent/sec
Number of network packets sent per second
User Level Analysis
Learn more about User Level Analysis by watching the User Level Analysis screencast
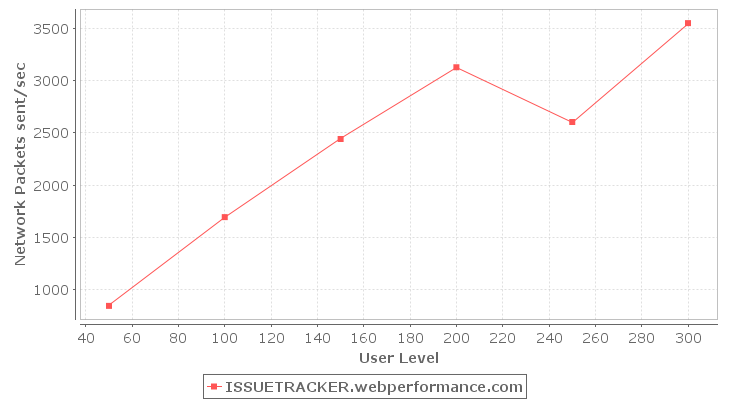
| User Level | ISSUETRACKER.webperformance.com |
| 50 | 846 |
| 100 | 1,695 |
| 150 | 2,442 |
| 200 | 3,128 |
| 250 | 2,604 |
| 300 | 3,550 |
Time-based Analysis
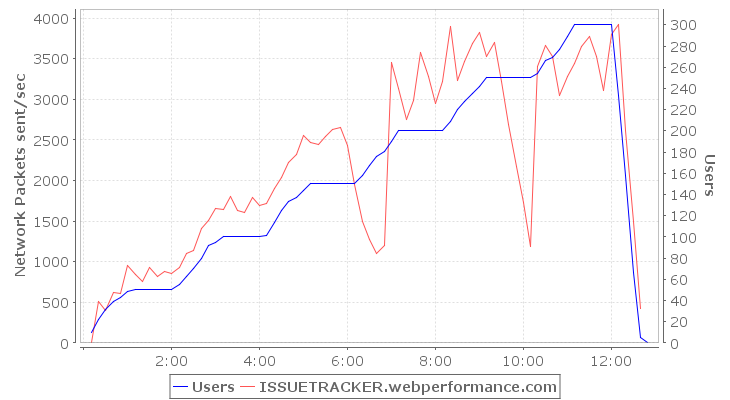
| Time | Users | ISSUETRACKER.webperformance.com |
| 00:00:10 | 10 | 9 |
| 00:00:20 | 22 | 506 |
| 00:00:30 | 32 | 395 |
| 00:00:40 | 39 | 624 |
| 00:00:50 | 43 | 612 |
| 00:01:00 | 49 | 956 |
| 00:01:10 | 50 | 841 |
| 00:01:20 | 50 | 758 |
| 00:01:30 | 50 | 926 |
| 00:01:40 | 50 | 816 |
| 00:01:50 | 50 | 885 |
| 00:02:00 | 50 | 850 |
| 00:02:10 | 55 | 924 |
| 00:02:20 | 63 | 1,107 |
| 00:02:30 | 70 | 1,138 |
| 00:02:40 | 80 | 1,412 |
| 00:02:50 | 92 | 1,512 |
| 00:03:00 | 95 | 1,652 |
| 00:03:10 | 100 | 1,643 |
| 00:03:20 | 100 | 1,802 |
| 00:03:30 | 100 | 1,635 |
| 00:03:40 | 100 | 1,602 |
| 00:03:50 | 100 | 1,791 |
| 00:04:00 | 100 | 1,698 |
| 00:04:10 | 101 | 1,722 |
| 00:04:20 | 114 | 1,898 |
| 00:04:30 | 125 | 2,043 |
| 00:04:40 | 133 | 2,228 |
| 00:04:50 | 137 | 2,323 |
| 00:05:00 | 144 | 2,556 |
| 00:05:10 | 150 | 2,467 |
| 00:05:20 | 150 | 2,439 |
| 00:05:30 | 150 | 2,538 |
| 00:05:40 | 150 | 2,624 |
| 00:05:50 | 150 | 2,652 |
| 00:06:00 | 150 | 2,431 |
| 00:06:10 | 150 | 1,946 |
| 00:06:20 | 158 | 1,492 |
| 00:06:30 | 167 | 1,277 |
| 00:06:40 | 176 | 1,106 |
| 00:06:50 | 181 | 1,201 |
| 00:07:00 | 190 | 3,451 |
| 00:07:10 | 200 | 3,135 |
| 00:07:20 | 200 | 2,747 |
| 00:07:30 | 200 | 2,988 |
| 00:07:40 | 200 | 3,576 |
| 00:07:50 | 200 | 3,280 |
| 00:08:00 | 200 | 2,950 |
| 00:08:10 | 200 | 3,223 |
| 00:08:20 | 209 | 3,899 |
| 00:08:30 | 220 | 3,236 |
| 00:08:40 | 228 | 3,468 |
| 00:08:50 | 235 | 3,688 |
| 00:09:00 | 242 | 3,821 |
| 00:09:10 | 250 | 3,530 |
| 00:09:20 | 250 | 3,704 |
| 00:09:30 | 250 | 3,214 |
| 00:09:40 | 250 | 2,689 |
| 00:09:50 | 250 | 2,171 |
| 00:10:00 | 250 | 1,729 |
| 00:10:10 | 250 | 1,193 |
| 00:10:20 | 254 | 3,410 |
| 00:10:30 | 266 | 3,668 |
| 00:10:40 | 269 | 3,527 |
| 00:10:50 | 277 | 3,046 |
| 00:11:00 | 289 | 3,276 |
| 00:11:10 | 300 | 3,437 |
| 00:11:20 | 300 | 3,654 |
| 00:11:30 | 300 | 3,770 |
| 00:11:40 | 300 | 3,527 |
| 00:11:50 | 300 | 3,110 |
| 00:12:00 | 300 | 3,803 |
| 00:12:10 | 233 | 3,917 |
| 00:12:20 | 158 | 2,616 |
| 00:12:30 | 66 | 1,490 |
| 00:12:40 | 5 | 419 |
| 00:12:50 | 0 |
Bandwidth In
Network inbound throughput
User Level Analysis
Learn more about User Level Analysis by watching the User Level Analysis screencast
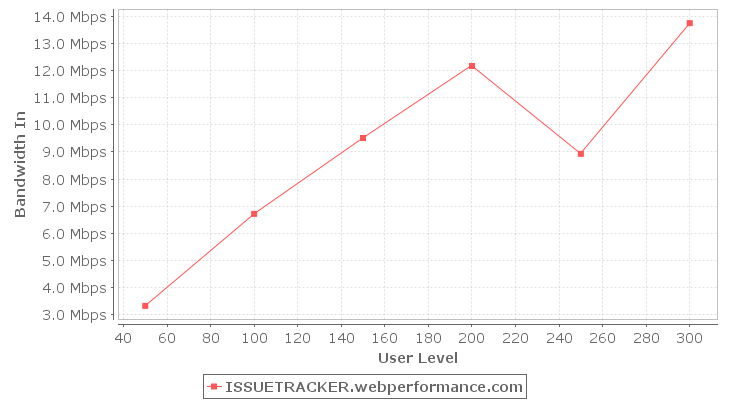
| User Level | ISSUETRACKER.webperformance.com |
| 50 | 3.3 Mbps |
| 100 | 6.7 Mbps |
| 150 | 9.5 Mbps |
| 200 | 12.2 Mbps |
| 250 | 8.9 Mbps |
| 300 | 13.7 Mbps |
Time-based Analysis
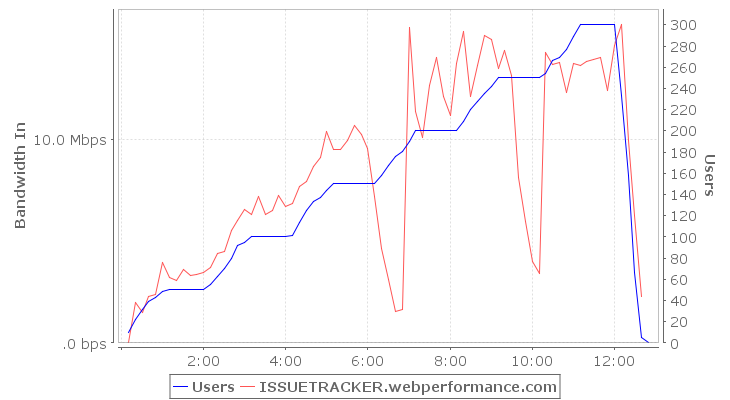
| Time | Users | ISSUETRACKER.webperformance.com |
| 00:00:10 | 10 | 12.9 kbps |
| 00:00:20 | 22 | 2.0 Mbps |
| 00:00:30 | 32 | 1.5 Mbps |
| 00:00:40 | 39 | 2.3 Mbps |
| 00:00:50 | 43 | 2.4 Mbps |
| 00:01:00 | 49 | 3.9 Mbps |
| 00:01:10 | 50 | 3.2 Mbps |
| 00:01:20 | 50 | 3.1 Mbps |
| 00:01:30 | 50 | 3.6 Mbps |
| 00:01:40 | 50 | 3.3 Mbps |
| 00:01:50 | 50 | 3.3 Mbps |
| 00:02:00 | 50 | 3.5 Mbps |
| 00:02:10 | 55 | 3.7 Mbps |
| 00:02:20 | 63 | 4.4 Mbps |
| 00:02:30 | 70 | 4.5 Mbps |
| 00:02:40 | 80 | 5.5 Mbps |
| 00:02:50 | 92 | 6.0 Mbps |
| 00:03:00 | 95 | 6.6 Mbps |
| 00:03:10 | 100 | 6.3 Mbps |
| 00:03:20 | 100 | 7.2 Mbps |
| 00:03:30 | 100 | 6.3 Mbps |
| 00:03:40 | 100 | 6.5 Mbps |
| 00:03:50 | 100 | 7.2 Mbps |
| 00:04:00 | 100 | 6.7 Mbps |
| 00:04:10 | 101 | 6.9 Mbps |
| 00:04:20 | 114 | 7.7 Mbps |
| 00:04:30 | 125 | 7.9 Mbps |
| 00:04:40 | 133 | 8.7 Mbps |
| 00:04:50 | 137 | 9.1 Mbps |
| 00:05:00 | 144 | 10.4 Mbps |
| 00:05:10 | 150 | 9.5 Mbps |
| 00:05:20 | 150 | 9.5 Mbps |
| 00:05:30 | 150 | 9.9 Mbps |
| 00:05:40 | 150 | 10.7 Mbps |
| 00:05:50 | 150 | 10.2 Mbps |
| 00:06:00 | 150 | 9.5 Mbps |
| 00:06:10 | 150 | 7.2 Mbps |
| 00:06:20 | 158 | 4.6 Mbps |
| 00:06:30 | 167 | 3.1 Mbps |
| 00:06:40 | 176 | 1.5 Mbps |
| 00:06:50 | 181 | 1.7 Mbps |
| 00:07:00 | 190 | 15.5 Mbps |
| 00:07:10 | 200 | 11.4 Mbps |
| 00:07:20 | 200 | 10.1 Mbps |
| 00:07:30 | 200 | 12.7 Mbps |
| 00:07:40 | 200 | 14.0 Mbps |
| 00:07:50 | 200 | 12.1 Mbps |
| 00:08:00 | 200 | 11.2 Mbps |
| 00:08:10 | 200 | 13.8 Mbps |
| 00:08:20 | 209 | 15.3 Mbps |
| 00:08:30 | 220 | 12.1 Mbps |
| 00:08:40 | 228 | 13.6 Mbps |
| 00:08:50 | 235 | 15.1 Mbps |
| 00:09:00 | 242 | 14.9 Mbps |
| 00:09:10 | 250 | 13.5 Mbps |
| 00:09:20 | 250 | 14.4 Mbps |
| 00:09:30 | 250 | 13.1 Mbps |
| 00:09:40 | 250 | 8.1 Mbps |
| 00:09:50 | 250 | 6.0 Mbps |
| 00:10:00 | 250 | 4.0 Mbps |
| 00:10:10 | 250 | 3.4 Mbps |
| 00:10:20 | 254 | 14.3 Mbps |
| 00:10:30 | 266 | 13.7 Mbps |
| 00:10:40 | 269 | 13.8 Mbps |
| 00:10:50 | 277 | 12.3 Mbps |
| 00:11:00 | 289 | 13.7 Mbps |
| 00:11:10 | 300 | 13.6 Mbps |
| 00:11:20 | 300 | 13.8 Mbps |
| 00:11:30 | 300 | 13.9 Mbps |
| 00:11:40 | 300 | 14.0 Mbps |
| 00:11:50 | 300 | 12.4 Mbps |
| 00:12:00 | 300 | 14.6 Mbps |
| 00:12:10 | 233 | 15.6 Mbps |
| 00:12:20 | 158 | 9.9 Mbps |
| 00:12:30 | 66 | 6.3 Mbps |
| 00:12:40 | 5 | 2.3 Mbps |
| 00:12:50 | 0 |
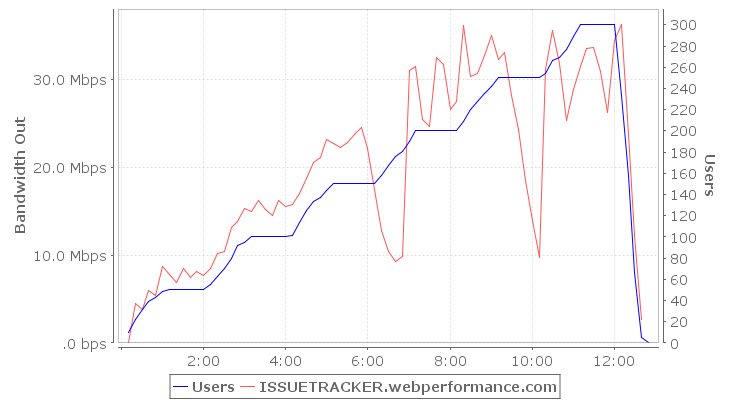
Bandwidth Out
Network outbound throughput
User Level Analysis
Learn more about User Level Analysis by watching the User Level Analysis screencast
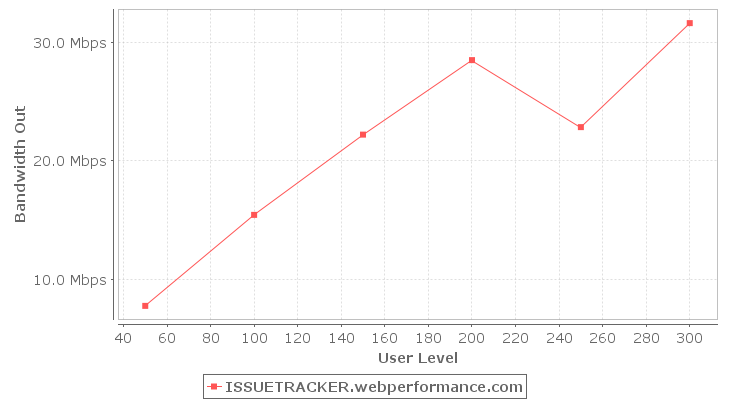
| User Level | ISSUETRACKER.webperformance.com |
| 50 | 7.7 Mbps |
| 100 | 15.4 Mbps |
| 150 | 22.2 Mbps |
| 200 | 28.5 Mbps |
| 250 | 22.9 Mbps |
| 300 | 31.6 Mbps |
Time-based Analysis
| Time | Users | ISSUETRACKER.webperformance.com |
| 00:00:10 | 10 | 39.2 kbps |
| 00:00:20 | 22 | 4.5 Mbps |
| 00:00:30 | 32 | 3.8 Mbps |
| 00:00:40 | 39 | 6.0 Mbps |
| 00:00:50 | 43 | 5.4 Mbps |
| 00:01:00 | 49 | 8.7 Mbps |
| 00:01:10 | 50 | 7.8 Mbps |
| 00:01:20 | 50 | 6.9 Mbps |
| 00:01:30 | 50 | 8.4 Mbps |
| 00:01:40 | 50 | 7.5 Mbps |
| 00:01:50 | 50 | 8.2 Mbps |
| 00:02:00 | 50 | 7.7 Mbps |
| 00:02:10 | 55 | 8.4 Mbps |
| 00:02:20 | 63 | 10.2 Mbps |
| 00:02:30 | 70 | 10.4 Mbps |
| 00:02:40 | 80 | 13.1 Mbps |
| 00:02:50 | 92 | 13.8 Mbps |
| 00:03:00 | 95 | 15.3 Mbps |
| 00:03:10 | 100 | 14.9 Mbps |
| 00:03:20 | 100 | 16.2 Mbps |
| 00:03:30 | 100 | 15.2 Mbps |
| 00:03:40 | 100 | 14.5 Mbps |
| 00:03:50 | 100 | 16.2 Mbps |
| 00:04:00 | 100 | 15.5 Mbps |
| 00:04:10 | 101 | 15.8 Mbps |
| 00:04:20 | 114 | 17.0 Mbps |
| 00:04:30 | 125 | 18.7 Mbps |
| 00:04:40 | 133 | 20.5 Mbps |
| 00:04:50 | 137 | 21.1 Mbps |
| 00:05:00 | 144 | 23.1 Mbps |
| 00:05:10 | 150 | 22.7 Mbps |
| 00:05:20 | 150 | 22.3 Mbps |
| 00:05:30 | 150 | 22.8 Mbps |
| 00:05:40 | 150 | 23.7 Mbps |
| 00:05:50 | 150 | 24.5 Mbps |
| 00:06:00 | 150 | 22.1 Mbps |
| 00:06:10 | 150 | 17.4 Mbps |
| 00:06:20 | 158 | 12.8 Mbps |
| 00:06:30 | 167 | 10.4 Mbps |
| 00:06:40 | 176 | 9.3 Mbps |
| 00:06:50 | 181 | 9.9 Mbps |
| 00:07:00 | 190 | 31.0 Mbps |
| 00:07:10 | 200 | 31.5 Mbps |
| 00:07:20 | 200 | 25.4 Mbps |
| 00:07:30 | 200 | 24.6 Mbps |
| 00:07:40 | 200 | 32.4 Mbps |
| 00:07:50 | 200 | 31.6 Mbps |
| 00:08:00 | 200 | 26.6 Mbps |
| 00:08:10 | 200 | 27.5 Mbps |
| 00:08:20 | 209 | 36.2 Mbps |
| 00:08:30 | 220 | 30.3 Mbps |
| 00:08:40 | 228 | 30.6 Mbps |
| 00:08:50 | 235 | 32.7 Mbps |
| 00:09:00 | 242 | 35.0 Mbps |
| 00:09:10 | 250 | 32.3 Mbps |
| 00:09:20 | 250 | 33.0 Mbps |
| 00:09:30 | 250 | 28.2 Mbps |
| 00:09:40 | 250 | 24.3 Mbps |
| 00:09:50 | 250 | 18.5 Mbps |
| 00:10:00 | 250 | 14.0 Mbps |
| 00:10:10 | 250 | 9.8 Mbps |
| 00:10:20 | 254 | 31.1 Mbps |
| 00:10:30 | 266 | 35.5 Mbps |
| 00:10:40 | 269 | 31.7 Mbps |
| 00:10:50 | 277 | 25.3 Mbps |
| 00:11:00 | 289 | 28.8 Mbps |
| 00:11:10 | 300 | 31.4 Mbps |
| 00:11:20 | 300 | 33.5 Mbps |
| 00:11:30 | 300 | 33.6 Mbps |
| 00:11:40 | 300 | 30.9 Mbps |
| 00:11:50 | 300 | 26.2 Mbps |
| 00:12:00 | 300 | 34.4 Mbps |
| 00:12:10 | 233 | 36.2 Mbps |
| 00:12:20 | 158 | 23.7 Mbps |
| 00:12:30 | 66 | 12.2 Mbps |
| 00:12:40 | 5 | 2.7 Mbps |
| 00:12:50 | 0 |
Network Packets Received Errors
Number of network packets received with errors
User Level Analysis
Learn more about User Level Analysis by watching the User Level Analysis screencast
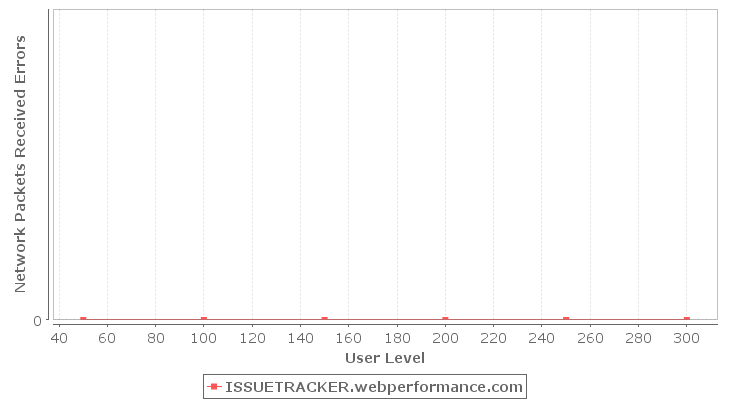
| User Level | ISSUETRACKER.webperformance.com |
| 50 | 0 |
| 100 | 0 |
| 150 | 0 |
| 200 | 0 |
| 250 | 0 |
| 300 | 0 |
Time-based Analysis
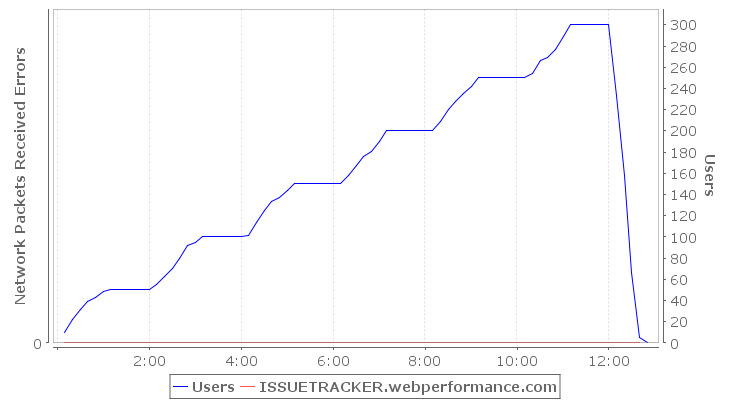
| Time | Users | ISSUETRACKER.webperformance.com |
| 00:00:10 | 10 | 0 |
| 00:00:20 | 22 | 0 |
| 00:00:30 | 32 | 0 |
| 00:00:40 | 39 | 0 |
| 00:00:50 | 43 | 0 |
| 00:01:00 | 49 | 0 |
| 00:01:10 | 50 | 0 |
| 00:01:20 | 50 | 0 |
| 00:01:30 | 50 | 0 |
| 00:01:40 | 50 | 0 |
| 00:01:50 | 50 | 0 |
| 00:02:00 | 50 | 0 |
| 00:02:10 | 55 | 0 |
| 00:02:20 | 63 | 0 |
| 00:02:30 | 70 | 0 |
| 00:02:40 | 80 | 0 |
| 00:02:50 | 92 | 0 |
| 00:03:00 | 95 | 0 |
| 00:03:10 | 100 | 0 |
| 00:03:20 | 100 | 0 |
| 00:03:30 | 100 | 0 |
| 00:03:40 | 100 | 0 |
| 00:03:50 | 100 | 0 |
| 00:04:00 | 100 | 0 |
| 00:04:10 | 101 | 0 |
| 00:04:20 | 114 | 0 |
| 00:04:30 | 125 | 0 |
| 00:04:40 | 133 | 0 |
| 00:04:50 | 137 | 0 |
| 00:05:00 | 144 | 0 |
| 00:05:10 | 150 | 0 |
| 00:05:20 | 150 | 0 |
| 00:05:30 | 150 | 0 |
| 00:05:40 | 150 | 0 |
| 00:05:50 | 150 | 0 |
| 00:06:00 | 150 | 0 |
| 00:06:10 | 150 | 0 |
| 00:06:20 | 158 | 0 |
| 00:06:30 | 167 | 0 |
| 00:06:40 | 176 | 0 |
| 00:06:50 | 181 | 0 |
| 00:07:00 | 190 | 0 |
| 00:07:10 | 200 | 0 |
| 00:07:20 | 200 | 0 |
| 00:07:30 | 200 | 0 |
| 00:07:40 | 200 | 0 |
| 00:07:50 | 200 | 0 |
| 00:08:00 | 200 | 0 |
| 00:08:10 | 200 | 0 |
| 00:08:20 | 209 | 0 |
| 00:08:30 | 220 | 0 |
| 00:08:40 | 228 | 0 |
| 00:08:50 | 235 | 0 |
| 00:09:00 | 242 | 0 |
| 00:09:10 | 250 | 0 |
| 00:09:20 | 250 | 0 |
| 00:09:30 | 250 | 0 |
| 00:09:40 | 250 | 0 |
| 00:09:50 | 250 | 0 |
| 00:10:00 | 250 | 0 |
| 00:10:10 | 250 | 0 |
| 00:10:20 | 254 | 0 |
| 00:10:30 | 266 | 0 |
| 00:10:40 | 269 | 0 |
| 00:10:50 | 277 | 0 |
| 00:11:00 | 289 | 0 |
| 00:11:10 | 300 | 0 |
| 00:11:20 | 300 | 0 |
| 00:11:30 | 300 | 0 |
| 00:11:40 | 300 | 0 |
| 00:11:50 | 300 | 0 |
| 00:12:00 | 300 | 0 |
| 00:12:10 | 233 | 0 |
| 00:12:20 | 158 | 0 |
| 00:12:30 | 66 | 0 |
| 00:12:40 | 5 | 0 |
| 00:12:50 | 0 |
Network Packets Sent Errors
Number of network packets sent with errors
User Level Analysis
Learn more about User Level Analysis by watching the User Level Analysis screencast
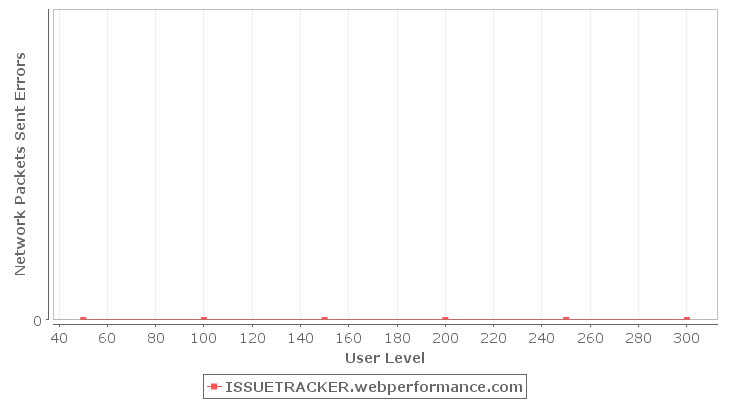
| User Level | ISSUETRACKER.webperformance.com |
| 50 | 0 |
| 100 | 0 |
| 150 | 0 |
| 200 | 0 |
| 250 | 0 |
| 300 | 0 |
Time-based Analysis
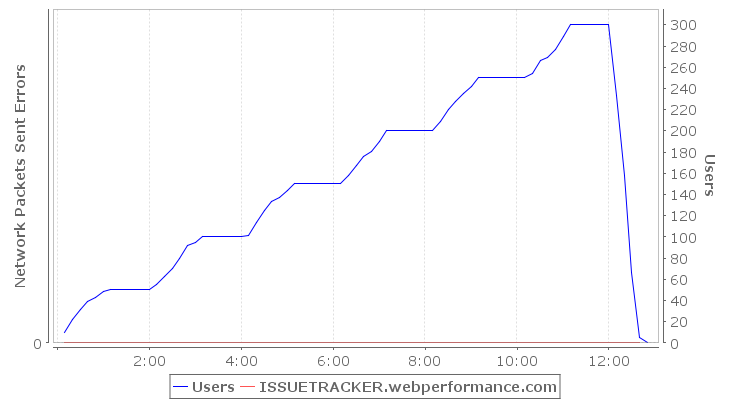
| Time | Users | ISSUETRACKER.webperformance.com |
| 00:00:10 | 10 | 0 |
| 00:00:20 | 22 | 0 |
| 00:00:30 | 32 | 0 |
| 00:00:40 | 39 | 0 |
| 00:00:50 | 43 | 0 |
| 00:01:00 | 49 | 0 |
| 00:01:10 | 50 | 0 |
| 00:01:20 | 50 | 0 |
| 00:01:30 | 50 | 0 |
| 00:01:40 | 50 | 0 |
| 00:01:50 | 50 | 0 |
| 00:02:00 | 50 | 0 |
| 00:02:10 | 55 | 0 |
| 00:02:20 | 63 | 0 |
| 00:02:30 | 70 | 0 |
| 00:02:40 | 80 | 0 |
| 00:02:50 | 92 | 0 |
| 00:03:00 | 95 | 0 |
| 00:03:10 | 100 | 0 |
| 00:03:20 | 100 | 0 |
| 00:03:30 | 100 | 0 |
| 00:03:40 | 100 | 0 |
| 00:03:50 | 100 | 0 |
| 00:04:00 | 100 | 0 |
| 00:04:10 | 101 | 0 |
| 00:04:20 | 114 | 0 |
| 00:04:30 | 125 | 0 |
| 00:04:40 | 133 | 0 |
| 00:04:50 | 137 | 0 |
| 00:05:00 | 144 | 0 |
| 00:05:10 | 150 | 0 |
| 00:05:20 | 150 | 0 |
| 00:05:30 | 150 | 0 |
| 00:05:40 | 150 | 0 |
| 00:05:50 | 150 | 0 |
| 00:06:00 | 150 | 0 |
| 00:06:10 | 150 | 0 |
| 00:06:20 | 158 | 0 |
| 00:06:30 | 167 | 0 |
| 00:06:40 | 176 | 0 |
| 00:06:50 | 181 | 0 |
| 00:07:00 | 190 | 0 |
| 00:07:10 | 200 | 0 |
| 00:07:20 | 200 | 0 |
| 00:07:30 | 200 | 0 |
| 00:07:40 | 200 | 0 |
| 00:07:50 | 200 | 0 |
| 00:08:00 | 200 | 0 |
| 00:08:10 | 200 | 0 |
| 00:08:20 | 209 | 0 |
| 00:08:30 | 220 | 0 |
| 00:08:40 | 228 | 0 |
| 00:08:50 | 235 | 0 |
| 00:09:00 | 242 | 0 |
| 00:09:10 | 250 | 0 |
| 00:09:20 | 250 | 0 |
| 00:09:30 | 250 | 0 |
| 00:09:40 | 250 | 0 |
| 00:09:50 | 250 | 0 |
| 00:10:00 | 250 | 0 |
| 00:10:10 | 250 | 0 |
| 00:10:20 | 254 | 0 |
| 00:10:30 | 266 | 0 |
| 00:10:40 | 269 | 0 |
| 00:10:50 | 277 | 0 |
| 00:11:00 | 289 | 0 |
| 00:11:10 | 300 | 0 |
| 00:11:20 | 300 | 0 |
| 00:11:30 | 300 | 0 |
| 00:11:40 | 300 | 0 |
| 00:11:50 | 300 | 0 |
| 00:12:00 | 300 | 0 |
| 00:12:10 | 233 | 0 |
| 00:12:20 | 158 | 0 |
| 00:12:30 | 66 | 0 |
| 00:12:40 | 5 | 0 |
| 00:12:50 | 0 |
TCP Connections Established
Number of open TCP connections
User Level Analysis
Learn more about User Level Analysis by watching the User Level Analysis screencast
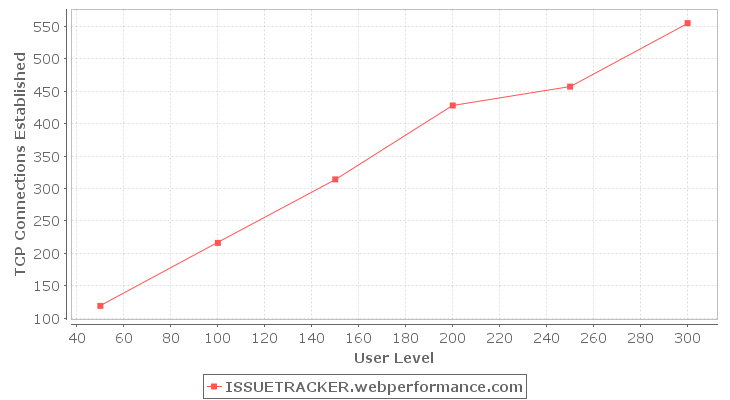
| User Level | ISSUETRACKER.webperformance.com |
| 50 | 119 |
| 100 | 216 |
| 150 | 314 |
| 200 | 428 |
| 250 | 457 |
| 300 | 555 |
Time-based Analysis
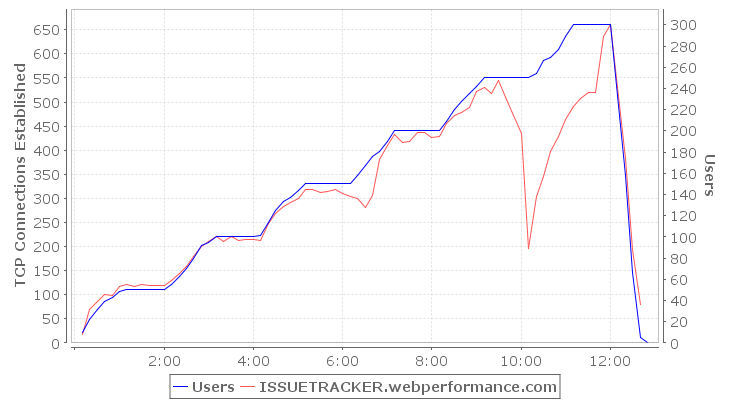
| Time | Users | ISSUETRACKER.webperformance.com |
| 00:00:10 | 10 | 18 |
| 00:00:20 | 22 | 69 |
| 00:00:30 | 32 | 87 |
| 00:00:40 | 39 | 101 |
| 00:00:50 | 43 | 99 |
| 00:01:00 | 49 | 118 |
| 00:01:10 | 50 | 122 |
| 00:01:20 | 50 | 117 |
| 00:01:30 | 50 | 121 |
| 00:01:40 | 50 | 119 |
| 00:01:50 | 50 | 119 |
| 00:02:00 | 50 | 119 |
| 00:02:10 | 55 | 129 |
| 00:02:20 | 63 | 145 |
| 00:02:30 | 70 | 159 |
| 00:02:40 | 80 | 179 |
| 00:02:50 | 92 | 201 |
| 00:03:00 | 95 | 211 |
| 00:03:10 | 100 | 221 |
| 00:03:20 | 100 | 211 |
| 00:03:30 | 100 | 221 |
| 00:03:40 | 100 | 213 |
| 00:03:50 | 100 | 215 |
| 00:04:00 | 100 | 215 |
| 00:04:10 | 101 | 213 |
| 00:04:20 | 114 | 247 |
| 00:04:30 | 125 | 269 |
| 00:04:40 | 133 | 283 |
| 00:04:50 | 137 | 291 |
| 00:05:00 | 144 | 300 |
| 00:05:10 | 150 | 318 |
| 00:05:20 | 150 | 319 |
| 00:05:30 | 150 | 313 |
| 00:05:40 | 150 | 314 |
| 00:05:50 | 150 | 319 |
| 00:06:00 | 150 | 311 |
| 00:06:10 | 150 | 305 |
| 00:06:20 | 158 | 300 |
| 00:06:30 | 167 | 282 |
| 00:06:40 | 176 | 307 |
| 00:06:50 | 181 | 381 |
| 00:07:00 | 190 | 410 |
| 00:07:10 | 200 | 433 |
| 00:07:20 | 200 | 417 |
| 00:07:30 | 200 | 419 |
| 00:07:40 | 200 | 437 |
| 00:07:50 | 200 | 437 |
| 00:08:00 | 200 | 427 |
| 00:08:10 | 200 | 428 |
| 00:08:20 | 209 | 456 |
| 00:08:30 | 220 | 473 |
| 00:08:40 | 228 | 479 |
| 00:08:50 | 235 | 488 |
| 00:09:00 | 242 | 521 |
| 00:09:10 | 250 | 530 |
| 00:09:20 | 250 | 517 |
| 00:09:30 | 250 | 545 |
| 00:09:40 | 250 | 505 |
| 00:09:50 | 250 | 472 |
| 00:10:00 | 250 | 435 |
| 00:10:10 | 250 | 197 |
| 00:10:20 | 254 | 303 |
| 00:10:30 | 266 | 345 |
| 00:10:40 | 269 | 397 |
| 00:10:50 | 277 | 429 |
| 00:11:00 | 289 | 464 |
| 00:11:10 | 300 | 491 |
| 00:11:20 | 300 | 507 |
| 00:11:30 | 300 | 519 |
| 00:11:40 | 300 | 519 |
| 00:11:50 | 300 | 637 |
| 00:12:00 | 300 | 661 |
| 00:12:10 | 233 | 531 |
| 00:12:20 | 158 | 383 |
| 00:12:30 | 66 | 195 |
| 00:12:40 | 5 | 79 |
| 00:12:50 | 0 |
TCP Connection Failures
Number of failed TCP connections
User Level Analysis
Learn more about User Level Analysis by watching the User Level Analysis screencast
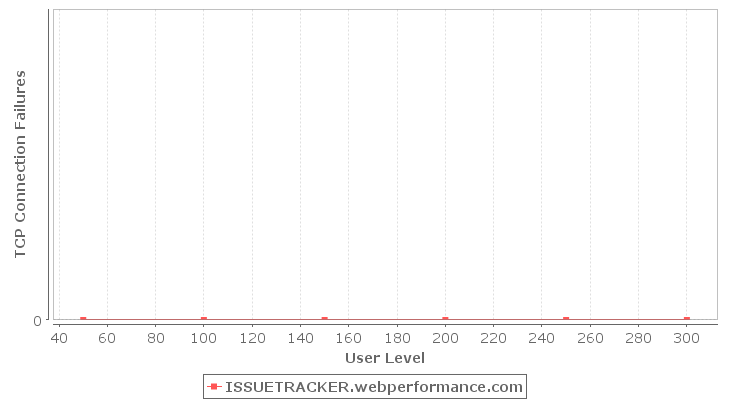
| User Level | ISSUETRACKER.webperformance.com |
| 50 | 0 |
| 100 | 0 |
| 150 | 0 |
| 200 | 0 |
| 250 | 0 |
| 300 | 0 |
Time-based Analysis
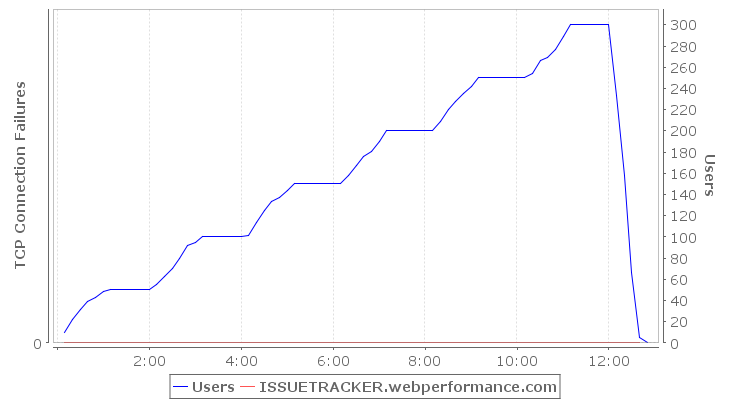
| Time | Users | ISSUETRACKER.webperformance.com |
| 00:00:10 | 10 | 0 |
| 00:00:20 | 22 | 0 |
| 00:00:30 | 32 | 0 |
| 00:00:40 | 39 | 0 |
| 00:00:50 | 43 | 0 |
| 00:01:00 | 49 | 0 |
| 00:01:10 | 50 | 0 |
| 00:01:20 | 50 | 0 |
| 00:01:30 | 50 | 0 |
| 00:01:40 | 50 | 0 |
| 00:01:50 | 50 | 0 |
| 00:02:00 | 50 | 0 |
| 00:02:10 | 55 | 0 |
| 00:02:20 | 63 | 0 |
| 00:02:30 | 70 | 0 |
| 00:02:40 | 80 | 0 |
| 00:02:50 | 92 | 0 |
| 00:03:00 | 95 | 0 |
| 00:03:10 | 100 | 0 |
| 00:03:20 | 100 | 0 |
| 00:03:30 | 100 | 0 |
| 00:03:40 | 100 | 0 |
| 00:03:50 | 100 | 0 |
| 00:04:00 | 100 | 0 |
| 00:04:10 | 101 | 0 |
| 00:04:20 | 114 | 0 |
| 00:04:30 | 125 | 0 |
| 00:04:40 | 133 | 0 |
| 00:04:50 | 137 | 0 |
| 00:05:00 | 144 | 0 |
| 00:05:10 | 150 | 0 |
| 00:05:20 | 150 | 0 |
| 00:05:30 | 150 | 0 |
| 00:05:40 | 150 | 0 |
| 00:05:50 | 150 | 0 |
| 00:06:00 | 150 | 0 |
| 00:06:10 | 150 | 0 |
| 00:06:20 | 158 | 0 |
| 00:06:30 | 167 | 0 |
| 00:06:40 | 176 | 0 |
| 00:06:50 | 181 | 0 |
| 00:07:00 | 190 | 0 |
| 00:07:10 | 200 | 0 |
| 00:07:20 | 200 | 0 |
| 00:07:30 | 200 | 0 |
| 00:07:40 | 200 | 0 |
| 00:07:50 | 200 | 0 |
| 00:08:00 | 200 | 0 |
| 00:08:10 | 200 | 0 |
| 00:08:20 | 209 | 0 |
| 00:08:30 | 220 | 0 |
| 00:08:40 | 228 | 0 |
| 00:08:50 | 235 | 0 |
| 00:09:00 | 242 | 0 |
| 00:09:10 | 250 | 0 |
| 00:09:20 | 250 | 0 |
| 00:09:30 | 250 | 0 |
| 00:09:40 | 250 | 0 |
| 00:09:50 | 250 | 0 |
| 00:10:00 | 250 | 0 |
| 00:10:10 | 250 | 0 |
| 00:10:20 | 254 | 0 |
| 00:10:30 | 266 | 0 |
| 00:10:40 | 269 | 0 |
| 00:10:50 | 277 | 0 |
| 00:11:00 | 289 | 0 |
| 00:11:10 | 300 | 0 |
| 00:11:20 | 300 | 0 |
| 00:11:30 | 300 | 0 |
| 00:11:40 | 300 | 0 |
| 00:11:50 | 300 | 0 |
| 00:12:00 | 300 | 0 |
| 00:12:10 | 233 | 0 |
| 00:12:20 | 158 | 0 |
| 00:12:30 | 66 | 0 |
| 00:12:40 | 5 | 0 |
| 00:12:50 | 0 |
TCP Segments Retransmitted/sec
Rate of previously transmitted TCP segments being retransmitted
User Level Analysis
Learn more about User Level Analysis by watching the User Level Analysis screencast
![]()
| User Level | ISSUETRACKER.webperformance.com |
| 50 | 55.0 |
| 100 | 98.5 |
| 150 | 147.0 |
| 200 | 189.5 |
| 250 | 124.5 |
| 300 | 163.9 |
Time-based Analysis
![]()
| Time | Users | ISSUETRACKER.webperformance.com |
| 00:00:10 | 10 | .0 |
| 00:00:20 | 22 | 19.9 |
| 00:00:30 | 32 | 33.6 |
| 00:00:40 | 39 | 56.5 |
| 00:00:50 | 43 | 29.1 |
| 00:01:00 | 49 | 53.4 |
| 00:01:10 | 50 | 49.7 |
| 00:01:20 | 50 | 44.4 |
| 00:01:30 | 50 | 56.2 |
| 00:01:40 | 50 | 54.6 |
| 00:01:50 | 50 | 74.4 |
| 00:02:00 | 50 | 51.0 |
| 00:02:10 | 55 | 51.9 |
| 00:02:20 | 63 | 55.4 |
| 00:02:30 | 70 | 65.2 |
| 00:02:40 | 80 | 114.4 |
| 00:02:50 | 92 | 76.5 |
| 00:03:00 | 95 | 89.5 |
| 00:03:10 | 100 | 112.9 |
| 00:03:20 | 100 | 110.2 |
| 00:03:30 | 100 | 113.9 |
| 00:03:40 | 100 | 67.4 |
| 00:03:50 | 100 | 98.1 |
| 00:04:00 | 100 | 88.4 |
| 00:04:10 | 101 | 82.8 |
| 00:04:20 | 114 | 85.2 |
| 00:04:30 | 125 | 142.6 |
| 00:04:40 | 133 | 137.2 |
| 00:04:50 | 137 | 141.5 |
| 00:05:00 | 144 | 138.2 |
| 00:05:10 | 150 | 184.6 |
| 00:05:20 | 150 | 133.2 |
| 00:05:30 | 150 | 145.3 |
| 00:05:40 | 150 | 154.7 |
| 00:05:50 | 150 | 173.0 |
| 00:06:00 | 150 | 159.9 |
| 00:06:10 | 150 | 78.0 |
| 00:06:20 | 158 | 48.4 |
| 00:06:30 | 167 | 10.4 |
| 00:06:40 | 176 | 7.2 |
| 00:06:50 | 181 | 10.0 |
| 00:07:00 | 190 | 195.4 |
| 00:07:10 | 200 | 285.0 |
| 00:07:20 | 200 | 160.2 |
| 00:07:30 | 200 | 141.1 |
| 00:07:40 | 200 | 177.3 |
| 00:07:50 | 200 | 264.1 |
| 00:08:00 | 200 | 156.2 |
| 00:08:10 | 200 | 142.8 |
| 00:08:20 | 209 | 216.1 |
| 00:08:30 | 220 | 201.1 |
| 00:08:40 | 228 | 141.6 |
| 00:08:50 | 235 | 178.7 |
| 00:09:00 | 242 | 246.2 |
| 00:09:10 | 250 | 222.0 |
| 00:09:20 | 250 | 207.7 |
| 00:09:30 | 250 | 144.7 |
| 00:09:40 | 250 | 151.8 |
| 00:09:50 | 250 | 58.6 |
| 00:10:00 | 250 | 22.6 |
| 00:10:10 | 250 | 64.1 |
| 00:10:20 | 254 | 244.0 |
| 00:10:30 | 266 | 220.4 |
| 00:10:40 | 269 | 136.6 |
| 00:10:50 | 277 | 86.7 |
| 00:11:00 | 289 | 163.1 |
| 00:11:10 | 300 | 240.7 |
| 00:11:20 | 300 | 139.9 |
| 00:11:30 | 300 | 157.0 |
| 00:11:40 | 300 | 150.0 |
| 00:11:50 | 300 | 131.0 |
| 00:12:00 | 300 | 164.7 |
| 00:12:10 | 233 | 219.9 |
| 00:12:20 | 158 | 133.8 |
| 00:12:30 | 66 | 44.7 |
| 00:12:40 | 5 | 6.6 |
| 00:12:50 | 0 |