| Load Test Report |  |
| 50 + 50 up to 300 |
Testcase Analysis: All Pages
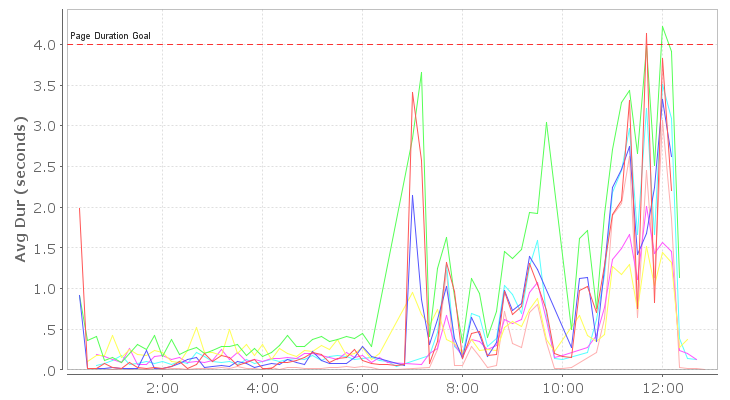
Average Page Durations
Combined chart of page durations shows the Average Duration of each page in the testcase.

| Page Name | Base Dur | Successes | Failures | Min Dur | Avg Dur | Max Dur | |
| • | Issue Tracker - Login [1] | .069 | 4,412 | 4,038 | .013 | .506 | 10.872 |
| • | Issue Tracker - Issues [1] | .040 | 2,830 | 2,009 | .017 | .902 | 6.152 |
| • | Issue Tracker - Issues [2] | .177 | 2,538 | 292 | .071 | 1.497 | 10.772 |
| • | Issue Tracker - Issues [3] | .044 | 2,822 | 5 | .032 | .502 | 8.054 |
| • | Issue Tracker - Issues [4] | .069 | 2,816 | 6 | .034 | .490 | 4.501 |
| • | Issue Tracker - Issues [5] | .330 | 2,658 | 158 | .028 | .724 | 7.880 |
| • | Issue Tracker - Login [2] | .034 | 2,813 | 3 | .008 | .443 | 4.984 |
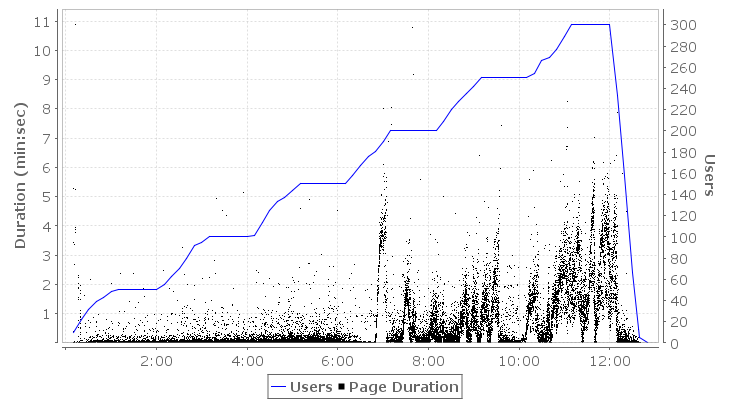
Detailed Page Durations
The Detailed Page Durations chart shows the duration of each completed page plotted as a single dot on the chart. This can give a more complete picture of system performance by differentiating the performance of majority of pages from the outliers.

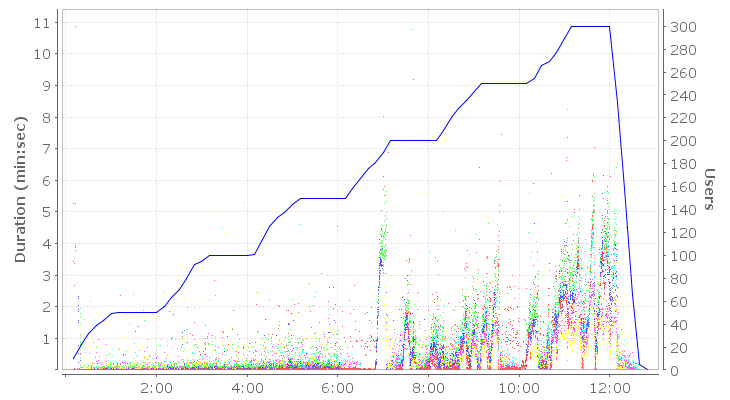
Detailed Page Durations (color)
The Detailed Page Durations (color) chart is similar to the monochrome Detailed Page Durations chart, but plots the each page in a different color. This may help quickly determine which page exhibits performance problems. Note that the dots are plotted in reverse order of the table below. Because a single dot cannot show multiple colors, a dot may hide the dots plotted previously at that point.

Performance Goal Analysis
This section analyzes the performance using the selected analysis methods and the performance goals configured on items within the testcase.
| User Level | Avg + 1 Std Dev | Avg + 2 Std Dev |
| 50 |  |
 |
| 100 |  |
 |
| 150 |  |
 |
| 200 |  |
 |
| 250 |  |
 |
| 300 |  |
 |
